| The Australian Energy Resource Assessment | The Oil Drum: Australia/New Zealand | Peak Oil And The Tea Party Movement |
The questions we don’t ask: A review of the Australian Energy Resource Assessment
Posted by Big Gav on March 5, 2010 - 8:56am in The Oil Drum: Australia/New Zealand
This is a guest post from Cameron Leckie of ASPO Australia.
There does not appear to be any metric by which we could argue that our current socioeconomic systems are sustainable. Despite this, we delude ourselves into believing that business as usual can continue indefinitely. We assist ourselves in this art of self-delusion by failing to ask the right questions or simply limiting the information that we are willing to consider. The recently released Australian Energy Resource Assessment (AERA), particularly the aspects related to oil, is yet another example of how our Government, and the bureaucracies supporting it, are failing to ask the right questions. The unfortunate consequences of this approach implies that Australia will be left with few options to respond to a very challenging set of problems, something that could and should be avoidable.
It should be noted that most of the information in Chapter three - oil of the AERA is good, particularly the assessment of Australia’s future oil production. To the lay person it would appear to be a thorough and accurate appraisal of Australia’s oil situation. The problem’s lie in the nuances, the fallacies, the assumptions and the reliance on a narrow and far from fool proof set of data and projections on the international oil arena. These shortfalls could have significant implications for Australia, so lets take a closer look.
World oil reserves and the R/P fallacy
The AERA confidently asserts that the world has 1,408 billion barrels of proven reserves (table 3.1). This data is sourced from BPs Statistical Review of World Energy 2009 (http://www.bp.com/productlanding.do?categoryId=6929&contentId=7044622). The statistical review is viewed as an energy bible by many, yet BP is so confident about this publication that it won’t even respond to questions about the data contained therein. The reason being that the information contained therein is not audited and of varying degrees of accuracy. The best example is provided by the 300 billion barrel jump in OPEC oil reserves during the 1980s. For example, Saudi Arabia’s oil reserves jumped from 170 billion barrels in 1987 to 255 billion barrels in 1988 and have remained at just over 260 billion barrels ever since. This story is repeated amongst most of the OPEC nations. So what happened in the 1980s. Was there a wave of new discoveries? The answer is no. But what we know did happen is that OPEC introduced a production quota system based upon oil reserves. So maybe, just maybe some of these ‘reserves’ are political numbers used to enhance the production quota of a nation. If this is the case, some 250 to 300 billion barrels, around a fifth of the worlds proven oil reserves may be paper barrels only.
We then move onto the Reserves/Production ratio, a simple calculation that suggests that there is 42 years worth of oil left at current production rates. The AERA quotes the International Energy Agency suggesting that oil production will increase at one per cent per annum out to 2030. This projection would see current reserves exhausted by 2047, only 37 years time. Subtracting $250 billion barrels of OPECs political reserves would see reserves exhausted by 2040, only 30 years time. Raise the growth in production to two per cent per annum and the oil age is potentially over by 2037. These figures are of course nonsense, oil will never run out entirely. We know this because the production profile of oilfields and oil regions roughly approximates a bell curve. Oil doesn’t run out, as the pressure drops each field just produces less and less until it reaches a point where it is not economically viable. So this is good news, we will still have oil for many decades (or centuries?) to come, it is just that the flow will not be the 80 odd million barrels a day that we currently produce and the global economy has come to depend upon.
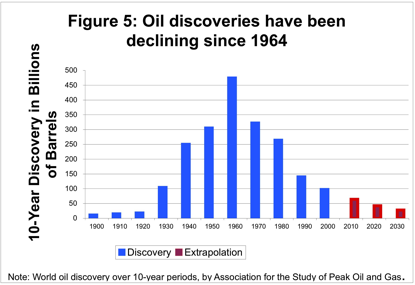
The AERA gets around this little problem by suggesting that new oil discoveries and reserves growth could offset the problem of declining reserves and production levels (p. 48). A very strong argument could be mounted to suggest that this is highly unlikely to occur. Despite significant technological advances, oil discoveries have been in long term decline for over forty years as shown in the chart.
The depletion rate from existing oil fields is somewhere in the order of 4.5 – 6% per annum (http://www.aspousa.org/index.php/2010/03/drawing-the-lower-and-upper-bou...), a figure that will continue to increase. Combining these factors, and the projects scheduled to come on line over the next few years (see chart below), it becomes obvious that world oil production is unlikely to grow much, if at all in coming decades, indeed the opposite is more likely the case. And this does not consider the many and varied geopolitical influences that could result in reduced production levels.
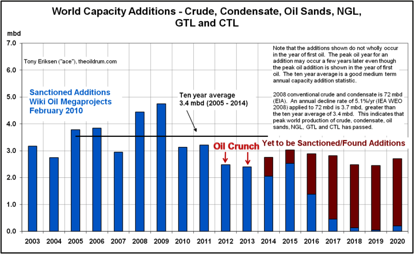
Source: http://energybulletin.net/node/51447
For some reason however the AERA does not detail these factors anywhere in its analysis. Unfortunately this is not the only gap in the AREA.
Exports and imports
‘a key assumption is that demand for oil will continue to grow and will be met from a variety of sources including imports, …..’ (p. 64)
If this is a key assumption, then the question of where these oil imports will be sourced from can, should, but hasn’t been asked. Australia’s oil production peaked in 2001 and is likely to continue declining according to the AREA. We now import a significant percentage of our oil requirements but with our consumption expected to grow by 1.3% per annum our imports are expected to increase at 3.3% per annum out to 2030. This will result in 75% of Australia’s oil requirements being sourced from over the sea. There is significant doubt that this volume of oil will be available in the future as I have written about previously (http://www.onlineopinion.com.au/view.asp?article=8842). The concept is not a difficult one to understand, as an oil exporting nations oil production goes into decline while its domestic consumption increases, the ability to export oil dwindles rapidly. Applying The Export Land Model (http://aspo-usa.com/2009presentations/Jeffrey_Brown_Oct_11_2009.pdf) to the world’s top five oil exporters, suggests that at the time Australia needs 75% of its oil requirements to be met by imports, that these countries will be approaching zero net oil exports. This calls into significant doubt the soundness of this key assumption and begs the question; what is plan B?
Oil intensity
Time to consider another misconception; the oil intensity of the economy. Oil intensity is the quantity of oil consumed per unit of GDP. The AERA states that:
The continued decrease in oil intensity also complements broader environmental and energy security policy goals. (p. 66)
This statement is disingenuous. Addressing oil intensity without addressing total consumption is a nearly pointless activity. For example if we double vehicle fuel efficiency but at the same time double the number of vehicles on the road then our fuel consumption remains the same. This is the point that focusing on oil intensity misses. Despite the decades long trend of declining oil intensity, total oil consumption has continued to increase as have greenhouse gas emissions. If we really want to complement environmental and energy security policy goals the key is increasing fuel efficiency and reducing the number of vehicles on the road and reducing the distance travelled.
Net energy
What is the difference between a barrel of crude sourced from Saudi Arabia and a barrel of synthetic oil sourced from the Canadian tar sands? The answer is net energy. One of the reasons that crude oil is such a useful energy source is that its net energy profit is so high. However net energy is a major disadvantage for all of the alternatives to crude oil such as biofuels, tar sands, oil shale, Coal to Liquids (CTL) and Gas to Liquids (GTL).
For example, the net energy profit of tar sands is about 4 (ie. five units of energy are produced for every one invested). A paper (http://www.mdpi.com/1996-1073/2/3/490/pdf) published in the peer reviewed journal Energies suggests that global oil and gas production had a net energy profit of 17 in 2006. The importance of this is that the alternatives to crude oil cannot compete on a barrel per barrel basis. So even though alternative fuels might offset some of the declines in crude oil, when considered on a net energy basis, the actual energy available for our economies to do useful work maybe much smaller, implying that our economies might also be smaller. Concepts such as net energy and energy returns on investment are concepts that governments, many economists and the team that wrote the AERA don’t seem to understand.
Conclusion
So there you have it. Thousands of hours of time and taxpayers money invested into a product that is incomplete, misleading and fails to grasp some fairly simple concepts. This results in an assessment of Australia’s future oil and liquid fuel situation that is not only unduly optimistic but also fails to provide the basis upon which a plan B can be developed for our nation as we enter the second half of the age of oil. This leaves us in the rather uncomfortable position of having a plan A, business as usual, which is not viable and no plan B. How, in a country as advanced as ours does this occur? Maybe if we could, as a society, resolve that question, we would be much better off, both now and into the future.
The questions we don’t ask: A review of the Australian Energy Resource Assessment
PDF version
20 comments
The questions we don’t ask: A review of the Australian Energy Resource Assessment
PDF version
20 comments
Contact
- anz at theoildrum dot com
License

This work is licensed under a Creative Commons Attribution-Share Alike 3.0 United States License.
Archives
- November 2010 (2)
- October 2010 (5)
- September 2010 (4)
- August 2010 (8)
- July 2010 (2)
- June 2010 (2)
- May 2010 (6)
- April 2010 (7)
- March 2010 (12)
- February 2010 (11)
- January 2010 (7)
- December 2009 (10)
- November 2009 (6)
- October 2009 (7)
- September 2009 (10)
- August 2009 (10)
- July 2009 (3)
- June 2009 (14)
- May 2009 (10)
- April 2009 (15)
- March 2009 (16)
- February 2009 (16)
- January 2009 (15)
- December 2008 (15)
- November 2008 (23)
- October 2008 (25)
- September 2008 (24)
- August 2008 (30)
- July 2008 (44)
- June 2008 (38)
- May 2008 (48)
- April 2008 (43)
- March 2008 (29)
- February 2008 (32)
- January 2008 (30)
- December 2007 (26)
- November 2007 (32)
- October 2007 (11)
Gripping analysis, Cameron. Well done.
One relatively cheap way for Australia to cushion against supply shocks is to build more storage for crude and refined petroleum imports. (As with the U.S. National Petroleum Reserve. Let's call it "Plan A+".)
But as far as I can see, as oil import volumes grow, Australia's installed storage becomes less and less adequate to cover a major interruption to supplies without the economy going into a spin.
Great stuff Cameron - punchy and readable. You've made the topic accessible and interesting to the average reader - have you considered submitting this to the Fairfax papers? They are showing more interest in free opinion pieces these days.
Cheers, Mark
Thanks Mark and Cretaceous for your comments. I will have a crack with Fairfax, see how it goes.
Cameron
The MSH had another article on the report by Paddy Manning this weekend - Future's not looking sunny .
I didn't read the fossil fuel sections of this report as they are dead industries walking but your critique doesn't surprise me.
The reason we don't have a Plan B is that the political,public service and business structures can't,or won't,conceive of any possibility that business as usual won't continue ad infinitum.They think they can "manage" any minor hiccups like an oil shortage.
This complacent mind set is facilitated,at the moment,by Australia being the benificiary of demand for our mining products.The short sightedness of regarding Australia as a quarry seems to have escaped the aforementioned clan.
Under this sort of management there won't be a plan B at any time.There will be a panicked response to immediate and painful stimuli just as we have seen on a minor scale with the wasteful spending on economic stimulus.
I see natural gas as the core oil replacement. As a transport fuel it is comparable to petrol and diesel on an energy per kilogram basis not factoring whether it needs high or low pressure storage. I'm not sure to what extent NG can provide plastics feedstocks in the manner of oil refining byproducts.
It is possible that the need to switch to NG won't be grasped until the last minute. Petrol, diesel and LPG may stay affordable even as they run out due to a quiet economy. The big end of town like General Motors thinks we will switch to plug-in hybrid cars. Branson thinks planes will run on biofuel. However for range and power-to-weight I expect gas and gas derived liquids will be the go. That is many more NGVs than EVs and in the sky GTL will power aircraft, not bio-kerosene.
At the same time we want to export LNG, run more gas fired generation to back up wind farms and for less CO2 generally. If that coincides with a swing to NG for transport then our supposedly large gas reserves might not look so robust.
Therefore I suggest the AERA report be reworked to include NG as an oil replacement.
If we switched to gas for all our transport and power generation, and continued to expand LNG exports for a while, we have enough gas for about a century...
http://anz.theoildrum.com/node/4094
http://peakenergy.blogspot.com/2008/10/coal-seam-gas-producers-new-maste...
http://anz.theoildrum.com/node/6203
As a matter of personal interest (more for $hits and giggles than anything else at the moment) I've been looking for info on CNG/LPG Dual-fuel conversions. Reckon I can find any? :p
Even more interesting would be a tri-fuel (Petrol/LPG/CNG or Diesel/LPG/CNG) or quad-fuel (Petrol/LPG/CNG/Electric) conversion. :)
I've been thinking of a CNG tank in the car, replacing the existing fuel tank, with LPG and Petrol on a trailer for longer trips.
Gas is good.
Will we be obliged to give it away if things don't work out all that well in the rest of the world?
How long will it last then?
We are being a wee bit possessive?
And without big brother to back us up!
This is Terra Nullius after all.
Edit: Can anyone tell me how much carbon dioxide is released into the the atmosphere for every liter of de-salinated water?
According to this NSW study,
http://www.tai.org.au/documents/downloads/WP78.pdf
...coal-powered desalination would release about 5kg CO2-equivalent for every tonne of desal water.
However, the ever-efficient NSW Govt has pledged to use wind-power to drive the desal. (I'll leave it to you to work out how much CO2 is embodied in the wind towers and the ministerial 4WDs to transport the pollies to hill-top ribbon-cutting ceremonies.
I wonder if the embodied energy isn't perhaps in the Desal Plant?
A lot of pipes, pumps and membranes that need cleaning, maintaining and replacing...
Apparently Australia has approx. 500 ML/d of capacity installed which at 100% use equates to 2,500 tonnes CO2/d using the figures above (and assuming I've multiplied correctly ;-) ).
However, if this report is true, Figures in Table 2 suggest that alternative options would be far less power hungry.
Two more interesting links for you.
Energy consumption and membrane replacement (abstract)
FOULING OF REVERSE OSMOSIS AND ULTRAFILTRATION MEMBRANES: A CRITICAL REVIEW
Thanks Cretaceous.
5 kg per cubic meter.
Love the photo.
Gaggle of soft handed, pontificating Wallies come to grab the glory.
Not a Hard Hat among them.
According to wikipedia, the new Wonthaggi plant will use 90-120MW to produce 410Mlt/day.
Assuming steady production over 24 hours, 90,000-120,000kWh to produce 410,000t/24 = 17,100t. Thus, 5.3-7kWh electricity per tonne.
Electricity from Victoria is mostly from brown coal. The plant at Hazelwood is the most carbon-polluting in the Western world, managing 1.58kg CO2e per kWh. Most modern black coal plants manage 0.8-1.2. Of course not all our electricity comes from coal, some comes from gas, some from hydro (so we'll be using freshwater to make freshwater, brilliant!).
But it's fair to say we're looking at 6-10kg CO2e per tonne of water desalinated, or about a million tonnes of emissions from the plant annually. The Victorian government is asking us to limit domestic water consumption to 155lt per day per person, a bit over a tonne a week. So if we got all our water from desalination, that'd be 7-11kg CO2e extra emissions (since we already have some from pumping stations, maintenance crews, original construction, organic material rotting in dams, etc) from water consumption weekly, or 365-572kg CO2e annually. Not much compared to our current 25t or so, about half of which is stuff households can control (domestic energy consumption, transport, food, etc).
By comparison, to achieve the worldwide 85% reduction in greenhouse gas emissions would mean taking it down to an average of about 1,200kg CO2e per person worldwide. If we got all our water from desalination, that'd use up a third to half our fair share.
Not so great.
Domestic water consumption in Victoria's under 10% the total, agriculture's two-thirds of it. There's about 660lt of water used for each litre of milk we get. It's hideously inefficient. Even so, Victorians were reducing domestic consumption, and the water reservoirs were rising.
But reducing consumption means no ribbon-cutting ceremonies and no grand plans. Oh well.
Hi Kiashu,
Do you have a good link to the 660L water used for milk production?
I'd like to know how it is calculated.
TIA
'Embedded water' seems simple to add up, but has complications.
See http://en.wikipedia.org/wiki/Virtual_water
The most recent national comprehensive data is for 2004-5, at the ABS.
There we find that 2,276Glt were used in the dairy industry - most of this is irrigated pasture off the Murray-Darling. They use around 3Mlt/ha for pasture, whether it's dairy or beef etc. This is equivalent to 300mm of rain, by the way - about half Melbourne's annual average rainfall, or 2/3-4/5 what it's been the last few years.
Australia produces, according to Dairy Australia, 10 million tonnes of milk annually, or 10 billion litres.
2,276 billion litres water / 10 billion litres milk = 228 litres water per litre milk.
So my mistake, I was going off the Victoria figures from a few years back. Still - think of a container about the size of your fridge, there's that much water used for a litre or two of milk. Not spectacularly efficient.
I'll have to have a think about this... but I'm not sure that you can use the word "efficient" or "ineficient".
IT seems intuitive in this case because they are both liquids but...
The same ABS source gives 1,270,000 ML for sugar and wikipedia (for want of a better source) gives 36,000,000 tonnes of sugar.
Using the same method that means => 1,270,000 *1,000,000/36,000,000 = 35300 L/tonne.
How can I compare this to the milk figure to determine what is in fact "efficient".
By milk solids it would definately favour the sugar. But is that fair?
And a non food crop like cotton?
Well, "efficient" depends on the context.
If you're talking about a country being self-sufficient in food, then you want to use your water resources in a way that allows you to get a broad range of nutrients. So you want some milk, some sugar, some beef, some corn, some lettuces, and so on.
If you're talking about a country which produces a vast surplus of food, then you probably want to use your water resources in a way that maximises dollar income. So milk costs 230,000lt/tonne, and sugar 35,000lt/t, milk has to be worth 7 times as much as sugar in dollar terms to be worth it.
If you're talking about long-term sustainability and biodiversity, then you want a total water use which minimises drawing on aquifers - they become our emergency reserves - and rivers - we don't want them to dry up.
And so on. There are a lot of things to consider. But in general, some things are obviously stupidly wasteful of water, like growing rice in the Mallee, or hosing down the concrete on Sunday afternoons.
I figure, let's deal with the stupidly wasteful stuff first and worry about the little stuff later. Eliminating the stupid and obvious waste in households roughly halves water and energy use, the same's true of most commercial buildings. It can't be far off in agriculture and industry, either, judging by the enormous variation in water and energy use - you can get two farms or factories producing the same stuff in the same region, and they use vastly different amounts of resources.
Let's deal with the stupid and obvious waste, that'll halve our resource use. After that we can argue about the details.
Here in Sydney the government could save that 50% of water consumption quite easily by re-casting the billing formula. At present only 10% of my water bill is related to usage - so where's the incentive to save? (Other than expensive Govt "Greenwash" TV ads - and imagine how many long lunches the pollies enjoyed choosing the ad company - not to mention the model for the shower sequences!)
If I was the Dictator of NSW, my formula would be to triple all water bills (initally) and make usage count for 90% of the bill. I'd then use part of that revenue to provide a reasonable rebate (not give a discount to) pensioners and large families (who are always trotted out as the reason why usage charges can't be increased)and then when the general population make the obvious cuts in their water usage, most people's bills will be back at about the old level, the government will have the necessary revenue to run its infrastructure and we'll have reduced our water usage permanently by half. (In my case, since I've already cut my usage, I'll have a much cheaper water bill, thanks very much!)
What's wrong with this picture? Oh - we wouldn't need the massive $2B desal plant until Sydney's population hits 8 Million, and the pollies would miss out on all those long lunches for choosing the contractors, etc.!
A short but devestating reply to the limitations and blinkered thinking in the report. Good luck with Fairfax (if News LTD will publish Opinion from the likes of Ruth Limkin, I'd say you've got a good shot). The SMH is on a roll with their transport-focused, rail-supportive articles lately.