| The Bullroarer - Tuesday 17th February 2009 | The Oil Drum: Australia/New Zealand | The Bullroarer - Friday 20th February 2009 |
The Economics of Volatile Oil Prices
Posted by Phil Hart on February 18, 2009 - 10:12am in The Oil Drum: Australia/New Zealand
Considering the fundamental nature of oil supply and demand provides a coherent explanation not just for the rapid rise in oil prices, but also the dramatic fall.
In recent years, I despaired when I heard economists on TV explain oil's spectacular run up in prices by saying that 'demand was exceeding supply'. How could trained economists, in just a few short words, contradict the basic grounding in economics that I was taught early in my engineering degree?
Another popular explanation was 'market speculators' who were apparently exploiting us and walking away with squillions of dollars for a few easy hours work. Blaming the speculators seems to make even more sense now that we have watched the price of oil evaporate from $140 to $40 a barrel overnight. How can $140 have been anything other than speculation?
Speculation increases volatility in oil prices, but it cannot lead to a long-term bias in the price. Oil traders make money just as easily being 'short' oil as they do buying or going 'long'. If some traders have pushed a price irrationally high, others will go 'short' making their profits when the price readjusts. That is the ruthless 'price finding' of the market at work (just as the markets have ruthlessly found the value of Wall St stocks).
Disruptions to oil supply caused price spikes as buyers bid against each other to ensure their supplies for the following month are secure. When the crisis died down, prices fell steeply as buyers found themselves with oil that nobody was particularly desperate for anymore.
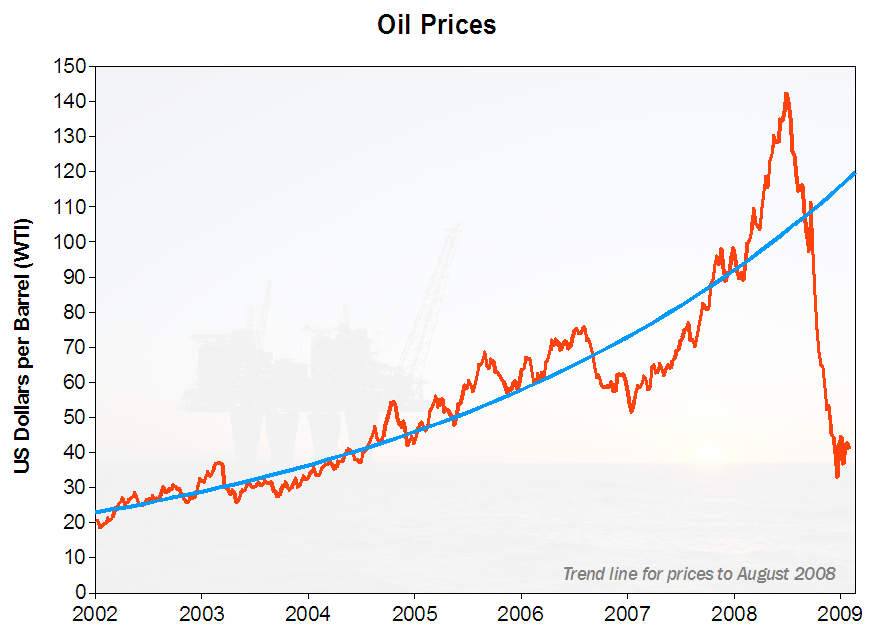
In the chart above, the trend line shows the increasing oil price necesssary to balance the market. The market could be above the trend line at times of disruptions to supply, or just as easily below the trend when it underestimated how much production would be available in coming months. Only with hindsight can we see when the market was over or under-priced. Since August 2008, we have clearly broken from the previous trend.
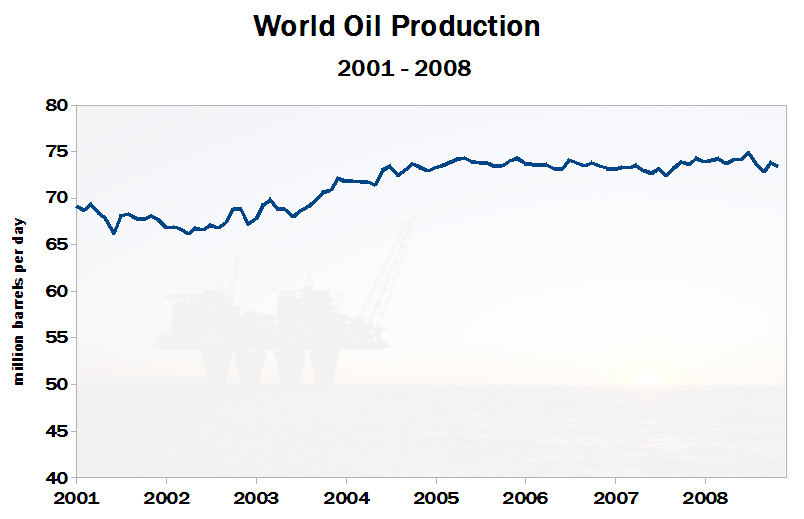
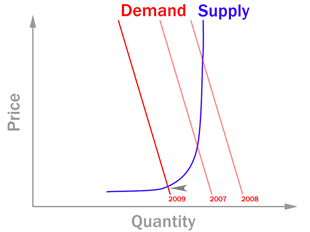
Oil production was relatively flat from 2004 to 2008, despite the rapid rise in prices. Once the world's maximum production capacity was reached, the supply curve for oil became vertical. It didn't matter how high the price went, oil producers could not bring any more oil onto the market.
But over the same period, the world's economies were still growing. The desire and thirst for oil was greater. The effect of this was to move the demand curve further to the right each year. But the demand curve is also steep - each individual user of oil, while bemoaning the high price, made little change to their own consumption. To force enough users to reduce their consumption and find a new equilibrium, the price had to rise quite significantly.
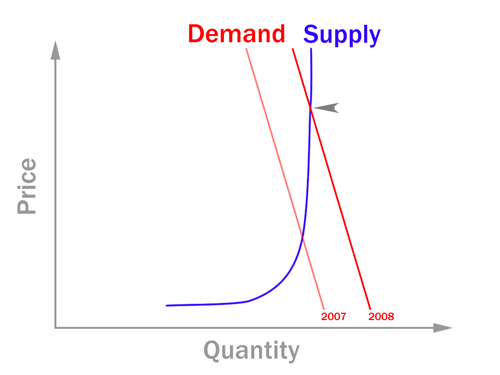
Demand curve moves right as the world economy grows from 2007 to 2008, requiring a much higher price to balance the market.
Demand was not 'exceeding' supply. But because both functions are 'steep' or 'inelastic' (not responsive to price), it required dramatic increases in price to find a new equilibrium between the two. This is the fundamental nature of constrained supply and robust demand that drove the oil price boom. It's not hard to see why there were predictions of $200 a barrel, on the assumption that the global economy could keep growing at its breakneck pace.
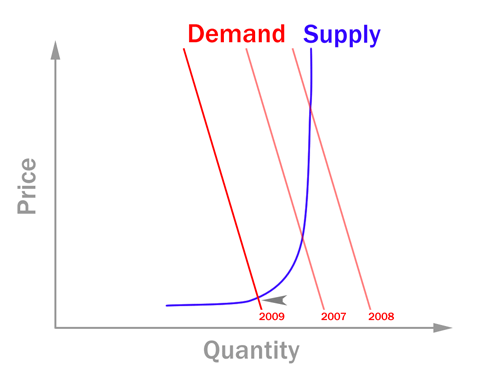
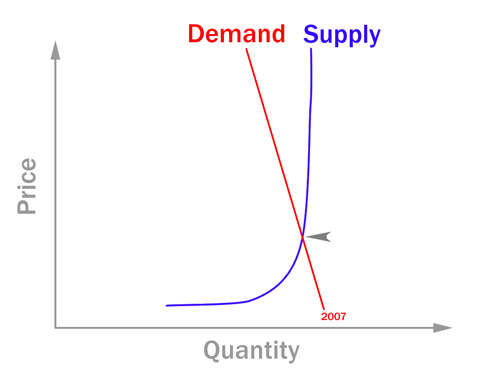
Demand curve for 2009 moves sharply left as the global economy contracts. It takes a steep drop in price to force enough producers to cut supply to balance the market.
On the way down, the oil companies are their own worst enemies, doomed to repeat the boom-bust cycle that has plagued the industry for decades.
The industry is capital intensive, hugely so, which is why it is dominated by big players. But once an oil field has been developed, the marginal cost of operating that field is relatively low. For most fields, the operating cost is still less than $40 per barrel. This means that most oil companies, despite the oil price collapse, are still producing today almost the same as they were twelve months ago at the top of the price cycle.
But demand has collapsed - the demand curve for 2009 has moved sharply left as economies unravel. So the oil price has to fall far enough to force some companies to cut production. If it weren't for OPEC cutting a few million barrels per day from their production, the price would fall even further until the market actually cut below the operating costs for a large enough fraction of the world's oil fields. Tar sands are feeling that impact already.
This price bust must eventually be followed by another boom. The impact of low oil prices is for oil companies to cancel their capital expenditure on new developments. The future supply curve is already being shifted to the left - the vertical asymptote on the supply curve will be at a lower production level in 2010 and following years than last year. Once demand recovers (shifts right), or just because supply begins to fall faster than demand, we will see prices rise again.
For more on the economics of supply and demand, see How to Address Contrarian Arguments – part III by Luis.
Contact
- anz at theoildrum dot com
License

This work is licensed under a Creative Commons Attribution-Share Alike 3.0 United States License.
Archives
- November 2010 (2)
- October 2010 (5)
- September 2010 (4)
- August 2010 (8)
- July 2010 (2)
- June 2010 (2)
- May 2010 (6)
- April 2010 (7)
- March 2010 (12)
- February 2010 (11)
- January 2010 (7)
- December 2009 (10)
- November 2009 (6)
- October 2009 (7)
- September 2009 (10)
- August 2009 (10)
- July 2009 (3)
- June 2009 (14)
- May 2009 (10)
- April 2009 (15)
- March 2009 (16)
- February 2009 (16)
- January 2009 (15)
- December 2008 (15)
- November 2008 (23)
- October 2008 (25)
- September 2008 (24)
- August 2008 (30)
- July 2008 (44)
- June 2008 (38)
- May 2008 (48)
- April 2008 (43)
- March 2008 (29)
- February 2008 (32)
- January 2008 (30)
- December 2007 (26)
- November 2007 (32)
- October 2007 (11)
There is a very nice YouTube video that animates these curves and shows how the price spike and recession mechanism work.
http://www.youtube.com/watch?v=T7vGDwGLU7s
that is nice.. short but sweet. i recommend watching that rather than reading my post :-)
Here is an article from Matt Simmons where he looks at some of the drivers.
"What I learned from Table 4.6 by Matt Simmons in World Energy Monthly Review.
http://www.worldenergysource.com/wes/stores/1/What-I-Learned-from-Table-...
Pretty good read on how demand may be restricted by supply.
That's a great video and really does a lot to dispel any "straight line to $500 oil" argument. I really hope that TPTB 'get' what's happening sooner rather than later. We are in for a series of (dep)recessions caused by this. As I posted previously 'Whale Bone' might give us a clue as to what lies ahead:
Perhaps high price -rather than fashion- is why the corset died out...?
Nick.
noutram,
+5 rating points for demonstrating how the "price" signal hides what's really going on with dwindling resources like whale parts.
A drop in price might be argued to be proof that the "peak" never happened even though we are well past peak.
Thanks.
jpods has a few more interesting graphs here
Exactly. I've been thinking for the last two years that all those Econ books I read were made of peanut butter and had been recalled.
Want to get a blank look? Try explaining that without supply, there is no demand.
jteehan says,
"Want to get a blank look? Try explaining that without supply, there is no demand."
Or more fascinating, try explaining that without demand, no matter how good and clean and modern your energy is, there no supply.
I used to drive 22 miles to work,now I drive less than 2 miles, and am looking at a house less than one quarter mile from work.
I have several friends who now have high speed internet and handle three of their workdays from a home office while they watch CNBC on HDTV, and track their investments on Bloomberg on the other computer.
We have not even began to see the advanced technology plug hybrids yet, and already oil demand is collapsing. Everyone is waiting for "when demand rebounds". What if it doesn't?
My young friends go boating every weekend, they are real junkies for the water. They use sailing dinghies, high performance, fun and fast, no fuel. With a bit of planning, they can ride together to the waterfront in a minivan, little fuel consumed, big fun had.
The world is changing more than most people seem to realize, and not in a bad way. The old oil economics are finished, over and done.
We knew it would happen. We knew it must happen. The transitional period is scary, and we are all lost as to exactly how to plan and invest to be ready for the coming post oil/post industrial age. We will figure it out, some better than others. The ones who are most married to the old age are in a state of hysteria. This too will pass. See you in the future, and I hope you have a great time there, because there is no where else to run, no where to hide from it.
RC
To me your confusing technology with energy. First world countries and developing countries will still consume enormous amounts of fossil fuels for many decades.
All the infrastructure that supports a high tech lifestyle is fossil fuel based. The number of people who can afford to work from home is limited.
You confuse oil with all energy.
Oil is the primary source of energy for transport which in turn supports infrastructure. It can't be substituted easily, but modern society is dependant on fossil fuel, that's why I mentioned it a few times!
http://en.wikipedia.org/wiki/Hirsch_report
Unfortunatley I don't have sufficient data to argue the point but I can't help thinking that we are decades away from any substitute for the quantity, energy density and general 'sunk costs' that our oil based economy embodies. I just have a bad feeling that we are mere years away from the decline of what may prove to be the lifeblood of modern civilisation and that worries me a bit because we're really NOT ready for the sh*t that's going to happen when it does...
Nick.
absolutely......the retail fuel industry has been screaming at legislators as well as the news media for over a year that normal market forces i.e. supply and demand, had broken down regarding oil / fuel prices. The curbing of speculation trading for commodity oil was and is needed. One of the quickest means of stimulating the economy is continued pressure for government to support domestic crude developement.Massive job creation is nearly instantaneous.Ya gotta back off some of the "over the top" regulations.In my region,central US,drilling has been shut down this year and jobs are going out the window until further notice.Meanwhile, we pay higher than expected fuel prices because of continued high import of oil.
VERY SIMPLE ECONOMICS = develope domestic crude.
There isn't nearly enough domestic crude to make a difference.
Nice presentation. But I'm left a bit confused. Do you think the price drop is due to drop in demand or not? Do you have independent evidence of the level of drop in demand? If so, is the amount of the drop sufficient to fully explain the price collapse?
On your "Oil Price" chart, the blue line would seem to indicate the long term trend in oil prices, the level that the price will eventually revert to on average not matter how speculators and other events may alter the price in the short term. Is that right?
If so, the blue line seems to be doubling about every three years, from a bit over $20 in 2002, to a bit more over $40 in 2005, to well over $80 in 2008. Should we expect prices then to be averaging $160 around 2011? Or will that curve flatten further as the depression deepens?
Would you expect the wild fluctuation that the red line in your price graph shows so dramatically over the last few months to continue? To moderate? To get ever wilder and more extreme?
Again, thanks for the clear presentation. I look forward to your further thoughts, analyses, and always-intelligent guesses.
Yes - I don't believe it can be anything else. Supply does not respond to small changes in price, so when demand drops even a little it takes a huge price drop to have any impact on supply.
I should have stopped the trend line in August 2008. It shows the average price trend over the last few years, showing when the market was ahead or behind the trend (for which there are various explanations). In theory, removing speculators from the market could have smoothed out the day to day, week to week volatility but not changed the average price.
That trend absolutely stopped last year and has no meaning any further in the future.
I have no idea what will happen to prices, except that they can't keep falling (or even stay this low) for very long.
Here is the "real" price curve to supply. I have a slightly updated curve that I have not published yet and it has not changed the nature of the curve.
For a larger image us the following link:
http://farm4.static.flickr.com/3186/2968324434_7bd464740b_o.jpg
Nice! Are the data points years? The split in the 55 MM BPD range is interesting.
They are monthly crude plus condensate production values from EIA. The oil cost is the monthly average composite refiner's aquisition cost, also from the EIA for the same corresponding months. The monthly data set runs from January 1974 to October 2008.
The split at the 55 MMBPD level represents the cost increase and subsequent collapse of oil productions in the 1979-1982 time frame. Oil aquisition costs remained high even though oil production had fallen from a high of about 64 MMBPD in November 1979 to a low of under 50 MMBPD in February 1983. Oil prices finally "collapsed" from ~$26/barrel in January 1986 to just over $11/bbl in July 1986.
After that price collapse, production/consumption began to increase again well into 1997, when the Russian/Asian financial crisis caused both oil prices and consumption/production to fall briefly.
Unlike the period in the early 1980's where production fell while oil prices stayed "high", in this case oil prices have collapsed while oil production/consumption has stayed relatively flat. That can be seen in this graphic
A larger size can be seen at:
http://farm4.static.flickr.com/3064/3095002973_600d067fc3_o.jpg
The Starship Trooper

Great chart. So we are currently on around 73 mmbpd and $35, still close to the curve. With decline eating 3.7 mmbpd / annum, any shortfall between this figure and new capacity will move the curve left.
But where is the evidence for a collapse in consumption? All the public figures (e.g. from the EIA and IEA) seem to suggest that the decline has been small, of the order of 1% or less. So I keep reading about collapsing consumption but I can't find data to support that notion. It seems to be a case of argument from incredulity; it can't be anything else!
All the way to zero ... or five dollars!
There is another factor. I'll keep it brief;
What prices are measuring is production capacity rather than product.
For many years there was a consistent increase in demand - and leaving out inflation - this demand increased prices for crude resulting in more funds being available to further increase production. Consequently production increased, yet it lagged the increase in demand. Production increases never caught up with demand to the point where prices would fall.
Part of this was on account of inflation, but that is not central. Production itself - not the capital cost of it - is what matters.
By 2008 there was a very high level of production. Keep in mind this production is a non- economic activity; unlike banking, drilling wells and pumping oil does not require money (or credit), money facilitates the process but steel, geologists, pipe fitters and other industrial hardware are needed for production. Production takes place on its own account with resources that are inherent to it; out of cash flow. Oil production is basically self- propelled.
By Summer of 2008, the world was pricing a perceived production shortfall. This perception was reinforced by a continuation of the preceding many- years' trend. Also, it was stoked by the media and reflected in parallel bull markets in all other commodities. Yet, perception was false. Even when prices were over $120 dollars a barrel there were other stories in the same media of surplus oil being 'stored' in tankers in the Gulf of Arabia. At the highest price levels, there was sufficient oil available for all users. In other words, there was never a shortage of product, only a perception of a shortage of production.
When the surplus of oil became obvious, and could not be rationalized away the high price for product became unsupportable. The idea followed that high prices were causing 'demand destruction'. However, what was happening was a secular supply/demand imbalance. There was structural overproduction relative to demand. Demand was indeed declining because of the recession, but neither the decline in demand nor the accelerating shortage of credit affected the level of production capacity. That level is an outcome of the process; the large investment in it having already been made. Even with the depletion of the world's oil fields, there is still a great amount of production capacity, and there is an accompanying perception of a high level of capacity.
Consequently, any 'surplus' no matter how small is an indicator of excess capacity; of the continuing secular supply/demand imbalance. OPEC can announce cuts, they can actually shut some valves on pipes and reduce the flow, and some big fields can deplete dramatically, but geopolitics and the need for a constant revenue stream leaves the producers able to put a large fraction of available production onto the market - at any time. In other words, the oil available to produce is both absolutely and relatively very great, even if it is temporarily suspended there is no 'production destruction'.
As Phil indicated, the industry is very large with a large investment base. This capacity functions even at low product prices. Product can even be made available even at an economic 'loss' if only for a producer to maintain market share.
Against this background, any surplus on the market has the effect of continually forcing sales; product is sold at whatever price ... in order to clear the market. The perception is that tomorrow will bring increased supply OR that reduction in demand will have the same relative effect. As demand falls, the structural imbalance between capacity and demand increses; less oil sold and burned is oil that remains on the 'supply' side of the balance. It becomes reserve - or excess - capacity. Going forward, the less consumption the greater the imbalance.
Until there is an actual structural reduction of oil production capacity, not temporary cuts ... prices will drop. As demand continues to fall, the forcing mechanism of marginal oil surpluses - real or perceived - will become more and more powerful ultimagely pressing prices downward ... all the way to zero.
New ... there are other non- energy feedback mechanisms that come into play, but the short version has all these loops amplifying declines in price - making the forcing mechanism stronger still! Higher prices, to paraphrase Ronald Reagan lift all boats. Falling prices eventually leave all the boats aground. After this grounding point is reached, there is little that can raise the prices as only small amounts of money will be risked (or be available to risk) for higher, but still very small returns. Even if there are actual shortages, the price will only rise a little as higher prices will deter consumption. There might be long term $8 dollar oil.
The same mechanism is at play in other sectors of the world's economy. Deflation is a bitch ... I will leave to others the amount of economic activity which $8 oil reflects. It may be substantial or may be very reduced, but it will certainly be much less than in 2008.
Excellent Steve. I’ve worked in the oil patch 33 years and yours is the most concise explanation of pricing I’ve seen. So many folks want to ignore the psychology behind pricing trends and just want to view the process as some sort of a plot. It is horse trading. Sophisticated horse trading but none the less a negotiation. I think your most pertinent point deals with production capability vs. pricing. I’ve mentioned this before: at least with US oil produces (with whom I’m very familiar) low price periods do not drive them to lower production levels. Just the opposite: they do whatever they can to maximize production = maximize cash flow. I’ve seen many actually spend capital to even increase production capabilities to whatever extent possible during these low periods.
While OPEC production cuts don’t change production capabilities they are significant IMO. The price collapse in the mid 80’s was a direct result of the KSA cranking their valves open. They had constantly cut their production (as other OPEC members produced even more in the face of lower prices) to support pricing. Eventually they would have had to shut in 100% of their production by 1988 had they kept to their cut rate. Obviously that was not an option for them. But this is not 1986 and the KSA has much greater control as many OPEC members are probably at PO and know it. Additionally OPEC is not spending the $’s it had once budgeted for production expansion. It will take a good 6 to 12 months IMO for these efforts to be felt but it is coming. And the market expectation of tightening supplies may precede that time. And, as you point out, expectations can drive pricing more then some economist’s cross plot.
This is a great econ 101 lesson. Thanks.
You've made a convincing argument that the price run was not *only* driven by speculation. Speculation, however, should not be brushed aside simply because the general trend is supported by fundamentals of supply and demand elasticities.
There was a speculative frenzie, and speculators are less concerned with the underlying fundamentals as they are with making a bet that others will behave in some predictable manner.
In a regulated market free from speculation, the price would certainly have gone up. In less-than-perfectly regulated markets driven to hyper-drive by the magic of instant information (and fueled by the promise of easy money - pun intended), price escalation is accelerated... as is deceleration.
A final point should be made regarding the 'fundamentals'. If the supply and demand curves are as steep as you suggest (and I tend to believe that they are), and speculators were betting on the fundamentals (rather than what other investors would likely do), they would need very good real time information on supply and demand conditions. After all, if they were off by even a small fraction, the price impacts would be severe. I don't think this information exists.
After all, if they were off by even a small fraction, the price impacts would be severe. I don't think this information exists.
That is why the market is so unstable. Even looking back a few months, it is difficult to be accurate about either demand or supply.
You have the wrong idea about speculators. Speculators invest based on information and their view on fundamentals. The function of market (and speculators) is to try the get out the right price. Everyone trying speculating in something probably learned the hard way how to loose lots of money in very short time. As easy as you can speculate on rise, you can speculate on the fall. Every long position is always matched by a short position. There is no imbalance in the futures market. What determines the price is the current information.
Speculators generally reduce price volatility. If you take a look at net positions of large speculators (those who probably carefully plan their investment), you'll notice that they closed their long positions as price was going up. They were right and they pushed price lower that would otherwise be. Long position closing started on March, 2008. and ended in August 2008.
This works only if the rollover of futures
works. Because long oil rollover didn't work as credit crunch spread we have a glut of crude. The long positions had to be closed with the buying of the real commodity.
No, you can close long position without taking delivery and you also can trade futures with cash settlement only.
Future markets do not change underlying fundamentals of the market. No oil is withdrawn from market nor is added to the market.
"What determines the price is the current information."
You are right - but that does not exclude that "the current information." is wrong information...
Speculators might, and have been shown to be, wrong before.
"Speculators generally reduce"
You say it yourself - "generally". Was this the case spring 2008 to autumn 2008? That should be investigated,
maybe it was an exception?
Im calling your cards.
Yes, you are right, speculators can be wrong. However, speculation has two sides. In order to go long, you must find somebody who is willing to go short at that price. Because of this symmetry, it's highly unlikely that group of speculators can influence the market. If they overshoot on any side, they'll be hit with the opposite tactics. In other words, there has to be general consensus among all participants in the market about future price move. So that's why the locating "speculators" by CFTC has failed. Pushing the price above perceived fundamentals is extremely risky. When you buy heavy, it's true you can rise the price. However, as soon as you stop buying, fundamentals kick in and you are in deep trouble. Now the problem is you have to sell and probably you'll find out that your average selling price is less than your average buying price (because your selling will now push the price below fundamentals).
The problem with market information is the following: it's extremely hard to predict future. The longer you look, the harder it is to see anything. Market is right (efficient) in the long term, but in the short term... Definitely not. It's easy to prove by just looking the price history of various commodities and stock markets.
There are times when speculative action can change the balance (high activity in one direction because of liquidation or delta hedging or whatever). However, it last only so long. From March, buyers in the future markets were commercials, sellers were the large speculators.
I don't deny that psychology plays the role, I have never said that (any market is by definition speculation). However, I have seen no evidence on any group manipulating the price. It was general belief by all market participants that fueled the price in my opinion. Short term fundamentals are: if you can sell gasoline (or any other product) at some price, that price is right. That's how the market works. It's not the price of oil that raised prices of gasoline, but the other way around.
Thanks, you answered a question that was nagging me ... about marginal costs relative to development costs; sunk capital.
Your model is analogous to what is happening to the auto manufacturers, another massively capital- intensive industry. Demand is falling but the decline on the price curve is greater than the absolute decline in vehicle sales. Losing a few percent of sales was enough to tip the more vulnerable makers - those with the greatest amount of sunk capital - over the edge.
The demand for oil can not be represented by a straight line any more than supply can. In a vigorous economy in today's world (well, last year's world), oil is cheap for many purposes in a range of prices distinctly higher than equilibrium prices at supply levels near to but less than the maximum supply. This means that if the economy is working at the maximum possible oil supply -- a region in which the supply curve is vertical -- the demand curve in this region is also vertical and is coincident with the supply curve. There is no demand-supply equilibrium possible in such a region, and we can expect the price of oil in an efficient market to move along the vertical line to keep equal to its changing value to its most productive consumers, a movement that we should expect to be volatile.
The straight demand line in the graphics is definitely an approximation, but I think my view is pretty close to yours. Because supply and demand are inelastic (ie very steep), the price is volatile.
ok, but a volatile oil is a hydrocarbon liquid at reservoir conditions that doesnt behave as a "black" oil. a volatile oil has a significant fraction of intermediate(volatile) h-c components. it's just that when i see the two words together, i get nervous.
Demand and supply for oil has a short term inelasticity. However in a long term view the elasticity is quite high. That is a known phaenomena with raising pigs. Once demand for pork is high, price increases and farmers raise more pigs. In the short term this has no effect on supply. So an increasing number of farmers try to grab that opportunity. When the pigs grow up however there is an oversupply of pork and the price collapses.
The advantage of a cartel like OPEC is that they could provide short time supply elasticity. However when their spare capacity went to zero prices exploded. In the other direction if quota cuts are not observed prices collapse.
Thank you for this clear exposition, Phil. I almost feel I can understand econ 101 even though economists have the axes swapped on their graphs, with the independent variable on the vertical axis. ;-)
One other point - you are talking about "short-run" supply and demand. In the longer term, the theory goes, price volatility motivates people to seek alternatives, so over time the elasticity of demand increases. People use a product when its price is low, and switch to alternatives when it is high. (Permanently, in the case of whale oil for lighting.)
It takes years for behaviour and infrastructure to change, though. The question is, do we have enough time? That's why we hang out on TOD :-)
Dang it - that's what happens when I take too long to proof-read. Jorn gets in ahead of me ;-)
Edit: on rereading, Jorn is talking about supply elasticity, and I about demand elasticity, which is slower to appear but more powerful in the end.
Thanx gregvp for the differentation of demand and supply elasticity. We (peak oilers) often argue that long term supply elasticity for oil is very limited. No matter how high the price of oil might get, it is not possible to increase the oil production when it is in terminal decline. Even tar sands, coal to liquids and bio fuels will not be able to reverse the trend in the long run.
Concerning demand elasticity there is good and bad elasticity: A shrinking economy is seen as undesireable whereas increased efficiency is seen as good. However increasing efficiency takes much longer than just shrinking the economy.
You got me scared.. but Quantity on x-axis seems to be pretty standard. Am I missing something?
Demand is usually expressed a function of price. But yeah, you've got the convention right.
Phil,
Yes you are.
From a pure math point of view, the x-axis (Quantity) goes on smoothly to infinity and beyond.
Similarly, in the pure math world, the y-axis (Price) goes down smoothly all the way to zero and up smoothly to infinity and beyond.
Price (P) cannot go below the costs break even points for their respective Quantity (Q) verticals and those cost break even points are functions of economies of scale.
Quantity (Q) values cannot extend to the right towards infinity due to geological rate-of-production limits.
If global Peak Oil is truly here and the number is 74-75 mbbl/d, then the PQ graph is exhibiting the effects of hitting up against one of the forbidden zones as prices rise to $140/bbl and above.
On the other hand, when prices drop below the cost break even points of the present day technologies, we are going to see a discontinuous drop towards Q=0. There won't be a smooth region between say, P=$20 and P=$0. The collapse will be a catastrophic one.
Phil,
I am surprised you did not speculate on what OPEC could do when enough of its members realize they are going broke and actually drop supply permanently below demand or just put a set price on various grades; take it or leave it!
When they do get control again on pricing its going to take more than a recession for consuming nations to take it away, will have to be a shift of consumers off oil.
Neil
This where the whole system is broken, if the Oil producers reduce supply they are also restricting the means of production to fund the price that they want.
If i am right then we are doomed to oscillation, reduce supply, push up prices, reduce oil fueled production, reduce demand for oil, price drops and then the sequence repeats.
Neven
Euan and I have both wondered how long it will take for this outcome to appear - it seems like a no-brainer to me as well. Set the price and then let the market determine the quantity - what could be better than that?
This would never work, because OPEC is not a single entity or a perfect monopoly.
As soon as they set price higher than the equilibrium, some capacity will go unused. This would likely affect some OPEC member countries more than others (that is, buyers will choose to buy only from those that are closest to them, or what not). Those countries will suffer disproportionately, and thus have an incentive to lower price albeit only a little, to encourage buyers to come back to them. Then that starts the price wars again and the scheme falls apart.
In sum, unless OPEC can somehow strictly enforce quotas as well as prices for EACH member country, they won't be able to set a fixed price like this.
This is why they have used quotas, not a fixed price, in the past. That way they achieve roughly the price increase they want, while making sure that individual countries still get "their share" of the pie. But even so, they have historically had trouble enforcing their quotas.
What evidence is there to know what "long-term" means? Is there any standard way to measure the magnitude of the speculation effect? One could argue that, "yes, you are right, but the whole spike $140-$35 is a speculating price-finding event... that takes a year to find its way to the "fair price" in the absence of good information". I know measuring or evaluating this is beyond economics 101, but I tend to look at economics 101 with skepticism. Any insight?
Traders go short just as easily as long and there are too many players in the oil market to control it (unlike the currencies of some small countries which have been manipulated).
All the traders want to do is guess the situation of the market tomorrow better than the punter next to them. If they think others are guessing wrong going long, they'll go short.
Don't get me wrong - I think the economic view of the world is completely screwed and I've spent a decade campaigning for a more sustainable approach, but blaming speculators for high oil prices doesn't help.
The price spiked because enough people thought it was going to be that hard to secure oil supplies - that was their best guess of where the market was going. Turns out they were wrong, just as they were wrong when they pushed the price down to $50 a barrel in early 2007. You don't hear anybody complaining about that though..
so what i should say is that you're right.. it does take time to 'find' the right price and there is an abscence of good information which is why the market could move so wildly. all i'm saying is that on average, the market could be wrong on the low side just as often as wrong on the high side.
Economics makes many fundamental assumptions about the way the world works (information being one of them). The oil market does not meet many of those assumptions so it's right to be skeptical. We need a different, better alternative..
There's a logical answer to this: speculators can't control the price of the physical commodity without controlling production or storage capacity in crude or products. Sure, they can lead arbitrageurs who have the physical assets required to intervene in the physical market but recent events* have demonstrated that arbitrageurs don't have much pull and/or need unreasonable spreads in order to offset their costs.
If you call Aramco and other sovereigns speculators then speculators are all-powerful. But if you use the usual definition which excludes producers, refiners and such, it's the storage capacity that speculators and arbitrageurs own or lease for that purpose that determines the amount of time they can prop the market up: once it's full, it's game over unless you want to allow for producers playing the arbitrage game by throttling production or some such (which sounds far fetched to me).
In any case, recent events* have shown that storage capacity gets overwhelmed fast if even a modest imbalance persists.
*I am of course talking about super-contango and the insane spreads between grades.
If you're talking about the future contract nearest to its expiry (what's displayed on the right of this page) you've also got whatever time is left before expiry during which speculators intent on losing money can run wild without any storage requirements.
Now, there are ways in which speculators can influence the markets indirectly, for example by taking positions in contracts that aren't going to expire for a while and influencing planning as well as price expectations in the industry. There's no theoretical limits to this kind of influence (besides the depth of the pockets of the speculators of course) but it's not what most people have in mind when they talk about speculation.
The futures market is closely tied to physical market it's easy to spot. I have almost never seen in the last few years that future contracts go beyond arbitrage conditions. It can happen only on very distant expiration dates due to lack of liquidity of those contracts.
Me again; I am asking because of interest. Im a dull scientist, so I like facts.
Thus what do you mean with "almost never in the last few years"? Got any data to convince me?
How about a few years ago when we went from backwardation(?) to contango (2006?)?
Wasnt that a massive change of perception? Contradicting your point above?
What do you think?
I said "I have never seen". It's very hard for me to prove that, however I check regularly price of futures. Also, I have seen some reports with futures history, showing the price of different maturity futures against time. I'll try to google it, maybe somebody has a link? It's pretty common in the reports.
It's always contango or backwardation within given limits. I have never seen next month future deviating from spot substantially. Or future for two months. It's always in arbitrage limits, which means that market is efficient and arbitrages out any opportunity. Has anyone seen such cases?
There is nothing wrong in switching from backwardation to contango and back. Spot surplus should trigger contango, spot deficit should trigger backwardation. You must take one fact in the consideration: future contract price does not suggests the future price of oil. It has been proven statistically (again I don't have a link, I don't keep all that stuff) that current spot price is better guess for future price than price of the future contract. This comes from the fact that price is more likely to rise when the futures are in backwardation and is more likely to fall when the futures are in contango.
And it's tough for anyone to tell you what you didn't see when you don't state what you deem the limits to be.
There's no reason for spot surplus to trigger contango all the way along the curve by the way.
Limits would obviously be cost of carry and risk free rate of return for contango (with the cost of carry dominating the equation). For backwardation, situation is bit more difficult, as convenience yield is not measurable directly.
Most of the arbitrage is possible only in first few months futures (due to liquidity issues), so the contango/backwardation plays there the most. Not liquid few years away futures carry no useful information.
Yeah but how high do you figure the costs are? We need a number to come up with examples when spreads were bigger.
I don't think the costs are fixed but you're the one who talked about limits, about the spot being tied to the futures and stuff.
Do you at least reckon that there are often bigger spreads between future contracts than between the spot and the near future these days and that the spreads between the near months are higher than between farther away months? What kind of arbitrage costs would explain that?
Why should arbitrageurs care about the liquidity of the futures by the way? Either you can get the contracts you need at a price that virtually guarantees you a profit or not. Again, the spreads tend to get smaller the farther out you go so either it's not arbitrage that keeps the spreads small or arbitrage has an easier time keeping prices in line the less liquid the contracts are.
Come on, now there is at least 80 million barrels of oil floating on the tankers alone. Plus other storage, it must be over 100 million barrels bought for contango arbitrage. Where is the hedge? 100.000 contracts must be shorted for that. That's unlikely to be in the illiquid long dated futures (with the open interest of few thousands, though you could find few months with much higher open interest). Also month spread is too small in later futures to be profitable.
http://seekingalpha.com/article/115939-four-ways-to-capitalize-on-super-...
What do you think, why is contango so deep? Anyway, now it is shrinking rapidly.
Keith did make a little factor of 42 error on tanker capacity
in his article. It would take a whole lot of boats that size to store much oil. I'm guessing the rest of his numbers were more accurate. I'd like get the barrel price for each of my gallons though ; )
PH, HF, Thanks for the comments and insights. (If anyone wonders what the *recent super-contango with insane spreads* is, have a look here)
I know little finance so excuse my candid approach, but real world commodities seem to be more complex than what textbooks say.
1) You mention no room for arbitrage (and I assume the arbitrage from buying tankers to store oil, playing with production, etc should be eliminated by the sheer number of other players).
2) The relationship between incomplete information (or group denial) and speculation is however very confusing to me, and definitions of what is arbitrage, supply and demand, etc seem to change depending on the time frame considered.
I'm not sure how much of the group psychology is captured in the models about options or futures, so just for me to understand let me imagine a simple model. Say we have 10 speculators, 5 producers and 5 consumers. The consumers are making lots of money because of a housing and credit bubble, they are growing, happily consuming. Producers can't exactly keep up with this consumption. So prices rise.
Say at $80 producers have good margin profits and consumers can expand the real economy (not forever, obviously).
But speculators + consumers + producers don't know this. That local equilibrium point is hard to identify, so the speculators are confused. 8 out of 10 think that the economy can expand forever and that production is tight. So even though there was a temporary equilibrium at $80, they start going long on their way to $140. The whole roller coaster $80 - $140 - $80 takes less than a year. Then, in this zero sum game, money changes hands between those who understood (or guessed) the timings and those who didn't. In the process prices changed wildly.
That's a reason why "manipulating" or "artificial" prices are hard to define (I think). After all if we knew the timing for peak oil and had a clear picture of the resources left, the prices would be very different, so all the money and guesses made now would be pure group behaviour making the market swing with no relation whatsoever to real future availability of commodities.
.... but I'll need to research the question a bit more.
The poor arbitrage thing is simple and doesn't relate to the number of players.
Arbitrage is profit-seeking behavior. There were recently opportunities to make large profits, for instance by buying the current contract and selling the next one. The profits would have been much larger than profit one would get by buying oil and selling the current contract (or buying the contract and selling oil). Yet, the persistent wild spreads show that arbitrage didn't happen on the scale required to balance the markets. And if the large profits weren't enough to trigger enough arbitrage, why would the smaller profits be enough?
The argument according to which futures drive the price of physical oil relies on fairly efficient arbitrage. Maybe there's efficient arbitrage in normal conditions, when there's no structural imbalance that overwhelms storage or something.
As to uncertainty, yeah... I've seen no evidence that anyone can predict the future or that there's such a thing as a "fundamental" price of oil. There's no equilibrium to be found here.
My 2¢ worth follows. BTW, average annual oil prices rose at an average rate of about +20%/year from 1998 to 2008, and oil prices rose for nine of the ten years. The fastest rate of increase was 2000, not 2008.
http://www.energybulletin.net/node/47541
A simple explanation for oil prices
Published Dec 22 2008 by Graphoilogy
by Jeffrey J. Brown
Assuming a current net export rate of about 7 Gb per year, our middle case estimate is that the remaining cumulative net oil exports from the top five would be depleted in 14 years at their current export rate.
http://r.hodges.home.comcast.net/~r.hodges/Chaos.html
In a way that is how I visualize what is happening to the global economy, with oil being the blood system, with many other input and outputs entwined in multiple feedback loops.
My question is, will the current attempts a restarting the chaotic slightly irregular cycles of a healthy economy, be sufficient to stop the fibrillating system from flat lining? Is such an endeavor even worth the effort?
Even if we manage to restart the economic heart for a while it seems that the system has been brain dead for quite some time. It may last for a while in a persistent vegetative state but when the life support in the form of bailouts and the like are removed the prognosis doesn't look very good.
The time for denial is over.
Great analogy - The Chaotic Heart
Here's a thought experiment for those who want to attribute high prices to speculators..
Imagine that, in the middle of the housing boom, you bought a house. You paid 20% more for the house than its price two years earlier. Were you speculating? Who was to blame for the price increase?
Hi Phil
I don't think you can entirely dismiss the role of speculation. Maybe not the short-term traders who net each other out, but the huge rise in primarily long-only etf money during the last couple of years. Almost overnight it became fashionable to 'diversify' portfolios into commodities - this was not a trivial flow.
An analogy for the housing market, certainly here in the UK, would be the fuel added by the buy-to-let boom. At some stage the rate at which money is withdrawn equals or even exceeds new money coming in but the effects can take a lot longer than the equilibrium between short-term traders.
TW
Everyone blames "speculators" for price bubbles. And while they share the blame, invariably they are just anticipating or following a trend.
With oil prices, did speculators push the price up to $140, or did they just correctly forecast that the dynamics of the supply and demand of oil is more likely to push the price up rather than down?
For it to be purely down to speculators, then it required the speculators to work together to all buy. This is both illegal (market manipulation and all that) and just plain difficult to do (as you are by definition trying to force the price to go the opposite direction to what it wants to go, and most traders would therefore just bet against it, rather than join in).
Ultimately speculators can do nothing more than exagerate the peaks and troughs, not create them.
I'm not so sure Nick. The production/demand numbers for the 4Q 2008 are beginning to be verified. During the period when oil prices collapsed the supply/demand dynamics changed very little. What did dramatically change was the vast number of futures contract owners who bailed out of the market at an unprecedented rate. That doesn't directly point a big finger at those folks for the price run up but it's clear that their efforts to unwind so quickly was a significant factor in the price collapse.
As far as there being a conspiratorial effort: I don't think so either. But that doesn't mean their combined efforts didn't affect the market. When 60,000 fans in a stadium start cheering their team simultaneously it doesn't mean they had conspired to do so. Widespread common motivators are well known in many markets. Remember the Cabbage Patch Doll? Everyone one that wanted to buy was able to in time. But the collective fear of missing out led to a crushing demand and ridicules pricing. What would have happened to the doll prices had, for some unknown reason, almost everyone who had bought a CPD had put theirs on EBay? I know the comparison sounds silly but the dynamics are the same.
You are one of the most convincing voices I've heard regarding speculators and oil prices.
Although the multi year runnup in prices, from 2000, with it's lack of real production increases for such a price response still overwhelms my thinking on the rise in price, I can't get a handle yet on the collapse. The argument of pricing at the last marginal barrel begins to sour, it will be interesting to watch Q4 supply and demand numbers.
Why doesn't any of you ever post evidence or at least a plausible mechanism through which these crafty speculators could do what you claim they do?
What do you think these supply and demand numbers will tell you? What would confirm or rebut your theory? I'm genuinely curious...
In most price collapses, people don't want the product anymore-whether it's tulip bulbs or cabbage patch dolls. As I haven't seen the evidence for this with oil, especially with a price drop over 3x, you wonder. My anecdotal, observational evidence-folks's local driving or energy usage, seems to be flat usage. Q4 demand numbers would help quantify impressions one way or the other.
In ag, we are used to hefty price swings in both directions. Wheat had the same spike-up to $20, depending on elevator and variety, now around $6. But here the responses were obvious and reported-large production increases, and blatant speculation whereby farmers or companies both withheld product and emptied elevators as bills came due.
It's not the case with oil. I'm not an advocate for the spec and oil side, just the opposite. But there doesn't seem to be enough evidence to explain the degree of collapse in oil prices.
Oil is more like grain than tulips or dolls obviously (most consumers keep consuming in a downturn) but there are also differences such as the seasonality.
If you look at the oil industry, you'll also see anecdotal evidence of speculation and arbitrage. There's much talk of floating storage for instance because it's spectacular.
I would still expect speculation to have more of an effect on grain prices though because of the ease of storage. On the other hand, there is the matter of the industrial use of oil which should make it fall harder on economic downturns.
You say there's not enough evidence to explain the collapse but how did you determine how much evidence is needed?
I also don't think you understand what the demand numbers are about: they'll always be very close to the supply numbers. You're not expecting people to dump the stuff in a hole somewhere, are you? The drop in supply and price is prima facie evidence of a drop in the desirability of oil, which is apparently what you believe the demand numbers should be about. If you assume that the price is driven by speculation, then it follows that there's no way to quantify how much people want oil because, again, the demand numbers only tell you roughly how much oil is consumed... or in other words how much demand there is at the current price, not how much demand there would be at last year's price or at what you deem the normal price.
Many numbers are already out for Q4 (and January even)... what do you think about those?
I think we're arguing back and forth around a tree, but...
EIA numbers showed demand easing slightly in the weeks of June, 08. It wasn't huge, 1-2% YOY and mostly industrial, IIRC. Prices eased somewhat, within expectations. There was demand data to support the price fall thru the rest of the summer. But not the crash from 140+ to nearly 30. To buy that, you have to believe that actual consumption fell and continues to fall. I did for awhile, now I have doubts that the whole story is known. I'm sure 08 and 09 world oil production amounts will not be that different. Bumps on the plateau.
Phil's work above has only 2 graphs that are data driven. The rest are just moving lines to illustrate his point. I would like such graphs to be supported by the data. I thought that was what Peak Oil analysis is all about-as Matt Simmons says, "show me the data."
You may be correct here, but I suspect we are missing part of the story with classical demand-supply curves. How big a part is unknown. Rockman posted several days back of his thoughts on the influence of options trading. Perhaps he will say more, perhaps it is just a hunch, but I'm not quite ready to swallow dancing graphs hook, line and sinker as the sole hypothesis without harder justifications.
But we already know actual consumption fell! I really don't understand what you hope to find in these numbers.
So your argument is that you believe that we're being fed lies by Oil Movements and gang and that supply isn't falling, which would explain the price weakness?
In other words, you believe there are massive secret exports from OPEC? Otherwise it would be very, very surprising if production ended up flat from 08 to 09. That would imply an staggering growth of global production capacity or a swift reversal of the cuts.
If one assumes that discipline w.r.t. the OPEC cuts was 75%, that supply from other countries was flat (unrealistic, I know... but good enough for this exercise) and that consumption was flat, one would need about 96 million barrels a month drawn from inventories to compensate once the cuts have rippled all the way to the storage hubs. The SPR would last little more than 6 months...
All the cuts haven't had time to travel all the way yet but the first cuts have been fully in effect for a while. And yet, reported inventories have increased, not dropped.
If consumption isn't decreasing substantially, where is the oil coming from? Non-OECD inventories?
The dancing graph hypothesis actually makes sense. It doesn't need to be the only one of course but if you've got nothing else that makes sense...
"The SPR would last little more than 6 months..."
i dont follow your calculation, but opec's el badri stated in late december that inventory was, iirc, 57 days oecd demand, 5 days more than normal. 5 days oecd demand is ca 250 million barrels, which is a small amount, really. but if demand exceeds supply by 1 million bpd, it would take 8 -9 months to burn off that excess inventory.
others have widely quoted 80 million barrels floating inventory, but that is not the only storage available to producers. every oil lease from prudhoe bay to parshall has a few days storage capacity.
so if one can believe these inventory numbers, then producers as well as traders were increasing inventory as the price was dropping from july to december, possibly thinking that a turn around was just around the corner. and as far as i know, they are still doing so and taking profits on the contango.
The latest STOE actually puts the inventory at 52 days 7 weeks ago, and the average under that. Maybe that's a typo. Not that it matters much here: either value means there's more than enough inventory. With any reasonable demand scenario, inventories would indeed be slow to revert to the mean (unless they actually grow further, that is).
Note that the EIA has inventories unusually high in the summer already so it looks like the inventory build happened earlier than you think.
As to the calculation, 4.2 * 0.75 = 3.15, not 1 (which you get by assuming a substantial drop in demand)... hopefully that clears up the counterfactual. It was intended to underly the absurdity of the steady demand conjecture, nothing more.
you build elaborate straw men.
Yes doug...just a hunch. But I could not accept that consumption fell fast enought to cause the price to drop as quickly as it did. And the numbers we're seeing now seem to deny any significant comsumption declines during that period. I work on the hard science side of the fence and would rather read the ideas of others and not try to grind out those charts myself. Just not my area of expertise.
Don't worry, the cost of marginal barrel will kick in. You don't have to generate profit to sell, you only have to generate positive cash flow. But you can keep on going that way only limited amount of time as you are depleting your capital.
What lot of people do not understand about demand: lower demand means that you demand same quantity at a lower price, not necessarily lower quantity at a lower price. So it is possible for price to drop substantially, yet consumption to stay the same. Also, price can also rise and yet consumption stays the same.
As long as your inventories are not building, current price is the market clearing price. If you turn that around, people filling gas tank at a price they cannot afford were - speculators. They were speculating that price will fall soon and make up the difference.
You also have to add monetary inflation, which additionally fed the price, plus negative feedback loop with producers - at a higher price, lot of producers were reluctant to add supply. Think state owned companies in major producing countries. As long as the money is coming in great amounts, they'll do nothing to invest (it's strange, but bureaucrats have strange minds) .
Your definition of demand isn't the one used by the agencies reporting demand. I like your definition better but it's likely to sow additional confusion.
That's because people working in the agencies are mostly economists and they desperately cannot read graphs. If you move demand curve to the left (lowering demand), at what price the same quantity is demanded?
If your demand some quantity of some product, when your income decreases for some reason, what must be the price for you to consume the same quantity as before? If the price falls enough, it is likely you'll keep buying the same amount. But producer is now losing his profit. When it falls below profitability level, production will be cut, thus balancing the market.
In this case you are talking lowering the prices to maintain a demand level. This is a deflation scenario when it covers the whole board of goods and services. It is not a new definition of lower demand. When the demand you are measuring is physically quantifiable eg. barrels of oil, bushels of wheat, it only goes down when fewer barrels or bushels are demanded per time unit. That is it. How else could you possibly define the lower demand?
That is a lower demand curve, not lower demand.
Speculating or investing certainly played a major role in running up the oil price in 2008. This is obvious because all commodities increased in price at the same time. Are you telling me that we had a sudden hard shortage of corn, gold and other commodities too?
I believe the reason for this speculating (investing) is that people had money to invest but the housing industry was in decline so people no longer were confortable investing there, and so people were looking for places to invest. Additionally, the dollar decreased in value so they wanted to invest rather than holding onto dollars.
I did my own liquid fuels supply/demand analysis based the megaprojects data base and based on the new crude oil and natural gas liquids coming on line as well as renewable fuels production that came on line in 2008, the oil price should have been around $70/bbl. Go back and review Skrebowski's post as he came to the same conclusion.
By the way, while some people simply went out to purchase houses for a places to live, many people did purchase houses using ARM loans expecting to flip it a year later and making a handsome profit. These investors drove up housing prices. When the housing bubble burst, these speculators were left holding the bag owning a house that they could not afford. These were speculators and their actions are a prime reason why we now have a financial crises.
I think that you need to do more research...
Retsel
There were commodities for which future contracts were not available which also spiked - how was that "speculation"
In reply to Rockmans post:
Although the supply/demand situation - the so called "fundamentals" didnt change much in August-September remember that to move the price - the market forces need only to percieve the future change. What we saw was not a real change in supply and demand, but the market saw the recession unfolded and quickly joined the dots. Hence everyone sold their contracts and ran for the hills. You dont need an actual supply glut to burst the bubble (or an actual shortage to cause one) you just need the conditions to ripen a little.
As Matt Simmons is fond of saying "$147/bbl is still cheap" what we saw as a massive spike is actually quite small - its small because speculators were able to see the future before it actually happened. By seeing a future shortage they drove the price up (thus softening demand and bolstering investment and supply). By foreseeing the oversupply situation the collapsed the price quickly.
If they hadnt driven the price up with their crystal ball - a REAL shortage may have occured, forcing prices to ridiculous numbers (many times higher than $147/bbl) - of course laymen would describe that as gouging - in supply demand economics no such thing exsists.
Stopping the speculation is like taking an important damper out of a system. Anyone familiar with controls/dynamics can see what i mean. Speculation is a damper than can see the future and react before it happens. Without it the market would jerk all over the place and make that "spike" look like a pimple.
Grain inventories hit 30 year low in 2008, we were consuming more than producing for years. Also, inventories of metals were also historically low. For example, steel was not traded on future markets until recently and did most of it's price run before that.
Interestingly, during great depression, speculators were blamed for food price fall. And also for crash of onion price so onions were banned from future markets. It didn't help, of course. Speculators were blamed for drop in stock market prices, most notably financial firms. So short selling was banned and prices did still fall. Stallin blamed speculators for famine in Russia, yet it was his "reforms" that turned one of the biggest crop producers in Europe into famine. So when politicians cry "speculators", I turn skeptical.
That is spelled "monetary inflation" in my dictionary. I wonder who was the cause of that? Oh, coincidentally, it was the same people screaming "speculators".
You forgot the policy which produced the flood of buyers pumping up the prices. Bank lending policy got riskier and riskier, because of government incentives. The incentives consisted of both FNMA purchase policies and CRA-induced incentives for issuance of loans to people who never would have qualified before; because of the CRA, bank managers willing to make shaky loans were allowed to buy up more risk-averse banks, but not the reverse.
This process caused bad management to drive out good. The bad management allowed and encouraged the impression that there would always be a "bigger fool", and the whole thing was the product of do-gooders in Washington.
As I've argued in other threads, it's not appropriate to compare commodities that are hard to store with assets.
Whatever you're doing with your house, you can't flip oil like people flip houses... otherwise this super-contango would never have happened.
Thanks for putting out a rational article on this. I don't agree with your curves but I think they were merely there for illustration. The basic demand-shift with macroeconomic conditions seems right though.
I think any halfway decent oil price model would have to take into account the time component in elasticity: the curves are very steep in the short term but loosen with time. Economics 101 doesn't even try to address stuff like that.
Hi Phil,
Great simple theory, very useful. However, as I have posted before, the actual real world complex dynamics of the production and use of such a resource as oil lends itself to a more chaotic analysis. To use fluid as a simile - (well oil is a fluid after all!) - of the dynamics of fluid flow in pipes, we find that turbulent flow is more common than laminar. Given the various demands on oil as a resource across a broad spectrum of markets (as well as fuel there are plastics and chemical/pharmaceuticals and numerous others), and the complexities of a capital investment orientated extraction industry the reality is of a perfect chaotic storm brewing on the horizon. One thing economists always seem to neglect is actual needs as opposed to artificially 'created' markets. Who knows where the chaos will take us, but once the 'needs' start to drive the process things could get quite interesting.
L,
Sid.
http://peakoil.com/forums/viewtopic.php?p=608751#p608751
This is a very simple set of differential equations that combines supply & demand curves with a Hubbert-like evolution of the extraction of a finite resource.
One thing it does not include is any kind of turbulence or chaos in the the way demand evolves. There are surely many other factors it leaves out... e.g. inflation, stockpiling, etc.
Hi Jim,
Nice model. And as you point out they do not include the turbulence. Or needs. A case of the Dmitri Orlov Paradigm, as he points out in this case:
As the Easter islanders found out all too late, the big giant heads were not 'needs' but artificially created wants, created by their religion of the time. And the religion of our time, in the 'age of Mammon' is economics. Note here religion is used in the dictionary sense of obligation, bond or reverence from its Latin meaning religio-onis. Of course the belief in economics as a superhuman controlling power cannot be ruled out, nor can cultural bias on historical events when related to the present ;-)
And:
From here.
Well it confirms my bias, Chaos reigns supreme...
L,
Sid.
One of the tweaks I think about, to better account for wants versus needs....
As it stands, the growth in "appetite" is a linear function of consumption. There is some steady state level of consumption, where appetite stays constant. Maybe as consumption drops below that steady state level, appetite should shrink more and more rapidly, since at first the lower priority items get dropped, then more vital items. On the other hand, as consumption rises above the steady state level, maybe growth should accelerate more slowly. Eventually folks will just be draining champagne bottles into the streets, i.e. consumption with no growth.
http://peakoil.com/forums/viewtopic.php?p=866208#p866208
Here are some tweaked equations and a sample simulation, to show limited growth but unlimited collapse.
Nice work Phil - nice and simple. I think your cartoon is better than the U-Tube one, since demand will not increase exponentially with low price - there is a limit to what we can use. But price does rise exponentially on the supply curve (as we saw) when a production limit is approached.
Do you think we are past peak?
One thing I’ve learnt, having closely watched production numbers and peak oil predictions since 2004, is not to be too brazen with one’s predictions.
I was mildly surprised to see 2008 production levels exceed the previous years. Six months ago I thought it was 'possible' for production to go one insignificant notch higher in 2009 before outright decline became evident beyond 2010. But now as every day goes by it looks more likely that peak production is behind us. We’re cancelling projects and drilling campaigns but production continues to deplete existing fields. Even in the most optimistic economic scenario I can’t see all the bits being put back together again quickly enough to exceed 2008 production.
What is your view now?
I think it is premature to say we are past peak. Much depends on whether or not capitalism survives the current crisis, if it doesn't then it is difficult to see circumstances that will push demand back up to the 2008 highs.
Assuming we get through the current trouble, which I think we will, then we have a complex interaction between natural decline, project scheduling, delays and postponements, and the building of reserve capacity in OPEC. OPEC have cut around 3 mmbpd thus far, and so presumably given demand, we could easily have hit new highs this year. Cuts in capital expenditure and decline will eat into that reserve capacity going forward.
Another important factor will be how psychologically damaged the major oil cos are. It took them a long time to respond to the higher price signal this decade. On the next price run up, I think they will be even more reluctant to commit investment to ever more expensive projects. Shtockman will be an interesting test case to see if StatoilHydro and Total are willing to risk billions developing reserves in the Arctic in a country with a poor corporate legal record.
Phil, good piece but I think you miss a few things. First, demand did exceed NEW supplies for a couple of years. In other words, inventories were being drawn down around the world. Check IEA or EIA world oil balance data and you can see there was a systemic supply/demand imbalance for about 2.5 years, generally coinciding with the run up in oil prices. Second, speculation certainly did play a role, but "speculation" is simply how markets function and I agree with you entirely that what the mainstream media labels as speculation was not the main factor in the run up at all - it was, as you suggest, supply/demand imbalances.
I discuss this and other issues in my similar piece posted at energypulse.net:
http://www.energypulse.net/centers/article/article_display.cfm?a_id=1926
Thanks Tam.
This is important to clarify.. consumption exceeded production - these are single data points - one can be higher than the other. Supply and demand are functions - ie lines on my charts. Unless the market completely breaks down, the two curves have an intersection somewhere. The demand function is not vertical so it will intersect the steep supply curve at some sufficiently high price.
Economists routinely say 'supply' when they mean 'production' and 'demand' when they mean 'consumption'.
"The term Demand is used interchangeably with the terms Consumption and Products Supplied." -EIA
So as we produce less and less oil as a result of geological constraints, will not the supply curve shift to the left?
For the time being, depletion will continue, but discoveries and development will be somewhat frozen. With each passing year of depressed economic activity, the supply curve will be shifting more and more to the left, but it will go unnoticed as long as the demand curve intersects it in a more horizontal portion of the supply curve. The balance between continued depletion and relatively frozen discovery/development will trap us in a increasingly more left shifted supply curve the longer we remain in the present economic malaise.
If you accept the simple idea that there is a cause and effect relationship between the amount of energy to fuel the economy and the size of the economy, then a shrinking supply of fuel should translate into a shrinking economic pie. Price is just the messenger that tells the economy to shrink when there are not adequate resources to allow it to expand. So if and when the economy attempts to expand at the end of the depression, oil prices should increase much more rapidly than they fell, and choke off the attempted recovery.
I would think that now we have entered an economic sink hole where any attempt to climb out will quickly be thwarted by energy constraints, and the later the date that any recovery is sparked, the more likely it will quickly be extinguished.
Edited: After I posted this I saw the link to the youtube video explaining this graphically. Sorry to post duplicate information, but then this is an important idea of which all should be aware.
EDIT sorry I meant this to be a new thread not a reply.
I think that the curves on both the youtube video and your graph are flawed.
The supply curve is correct - roughly speaking. Supply is limited - so at some point, increasing price does not yield increased production. In addition - a post peak curve will return zero supply at a higher price - that is to say that since the cheap oil is gone the supply curve will be zero at an increasingly higher price point.
The demand curve is not linear though. Demand is relativley unchanged with price until it reaches various pyschological or economical "break points". I think the demand curve is probably the hardest one to draw due to these effects.
the demand for oil is about the same at $40/bbl as it is a $20 or $10. When oil gets expensive enough to cause pain at the pump - last year that appeared to be about the $4/gal or $120/bbl mark - the demand falls some - not a LOT but a few percent.
If oil was to get MORE expensive - at some point it gets replaced with something else - demand falls faster with price.
Imagine if gas was $15/gallon. At that price people would literally dump gasoline powered cars for the nearest alternative. Buying a new car with batteries or Natural gas powerplants would be an easy choice to make, the expense offset by the fuel savings in a matter of months for the average consumer.
Eventually therefore there is a price ceiling above which the price cannot go. This "ceiling" depends on the availability of alternatives or the ability of the economy to sustain itself. If battery technology, EVs, and alternatives could be scaled up easily the ceiling will be lower. If we find instead "peak everything" (peak lithium, peak natural gas etc...) - that ceiling may be higher. But at some point we simply wont be able to afford it anymore.
The demand curve is of course able to move left if the economy crumbles and folks have less money to buy oil. Then as food runs out and the population dwindles it continues to move to the left.
thus I think it should look something like this:

Sinopec and Petrochina signed a deal loan for oil with Russia. The price of Russian oil these China companies get access to in return for a $25 billion bailout loan for a bankrupt Russian Oligarch is fixed to $20 a barrel for 20 years.
Both are happy with the deal, the Oligarch, and the Chinese.
No good news for oil permabulls.
Any reason why we should pay more attention to this strategic deal that has many unique clauses attached instead of the futures?
There are no 2029 futures, I'll grant you that. But surely the fact that 2016 futures and such are a wee bit above 20$ should be relevant, yes?
we should as futures are actively traded until 2016 but this part of Russian oil output is fixed by contract. This is a counter argument to permabulls' stance China will be the driver of oil prices.
We should, too, as Putin's negotiations to
trade Russian oil in rubles has failed.
WOW!!
How can I get in on that action?
I would love to own $20 oil for the next 20 years -I would be a king for sure, pass me the own-ur-own-island catalogue...
Nick.
Oil prices as a function of China demand are capped. More trade treaties between Russia and China are settled in USD not rubles.
No one not even the Russians wants rubles they want USD as cash not as liquidity on a bank account.
That means the perma oil bull's story of
exploding oil prices once "the economy recovers" is down and out.
Russia is as a consequence of Putin's and Kudrin's strict pro-Oligarch politics at the brink of bankruptcy they will have to sell oil at any price.
And that could mean the end of OPEC.
The foundations of a economical recovery
US and China are laid. EU and Russia will eventually pay the bill.
The Economist Magazine Predicts Low Oil Prices for Foreseeable Future:
http://www.casi.org.uk/discuss/1999/msg00181.html
I believe that the big drop of oil price is a maneuver from the symbiosis existing between the oil transnational’s (Exxon, Shell, etc) and the top developed administrations (USA and Europe) to remediate their countries present economic crisis, and to politically fight Russian pretentions.
What do you think about this?
Please reply
Jorge
I concur the Brzezinsky plan is still being executed and will succeed eventually.
However Putin and Kudrin did all they could to support the plan.
A developed economy can withstand one Madoff but an emerging economy cannot go on with a hundred Madoffs.
No russian Oligarch has the slightest idea
how to run a very big enterprise.
Jim Roger's advice from 2004 "let them take the money and let them run" was precisely to the point.
When economy comes down to dust you see who is a stupid Oligarch and who is a responsible entrepreneur. Rick Waggoner, for example, an Oligarch, not an entrepreneur. Russia has only unfavorable mergers of Waggoner and Madoff.
An example how russian economy leaders excel in basics is the cost-of-carry of
oil and gas. This cost is the highest amongst non OPEC oil and gas producers.
Nothing of significance has been done since the fall of USSR to improve lossy gas pipelines.
Hi, can anyone please advise any reliable industry information regarding the forecast for Australian diesel prices? I am aware that the Australian diesel prices are benchmarked against the Singapore Gasoil (50 parts per million suplphur content) but I cannot identify any forecasts for this. Although West texas is falling it does not seem to be a reliable indicator for Australian bowser prices given other factors such as AU to USD exchange rate; intensity in local competition and changes to international shipping freight rates. Given the industry is still paying line haul operators about 15% fuel surcharge, how do you know when you are not being ripped off? In my personal opinion, this article proves that after last year, economists have as much chance of predicting anything as tarot card readers ! thanks Alec