| How Will Local Governments Respond to Large Increases in Energy Bills? | The Oil Drum | One big sigh... (Sarkozy on lowering gas taxes) |
| Future Scenarios: Mapping the Cultural Implications of Peak Oil and Climate Change | The Oil Drum: Australia/New Zealand | The Bullroarer - Wednesday 28th May 2008 |
Oil Reserves: Where Ghawar goes, the rest of OPEC follows
Posted by Phil Hart on May 27, 2008 - 5:30pm in The Oil Drum: Australia/New Zealand
In May 2007, the work of Stuart Staniford and Euan Mearns culminated in a new and unprecedented assessment of oil reserves in Ghawar, the world's largest oil field. This article (also written in May 2007 and well overdue for TOD posting) combines their assessment with additional information sources, to produce a revised estimate of reserves in Saudi Arabia and the other OPEC countries.
Oil Reserves in Saudi Arabia
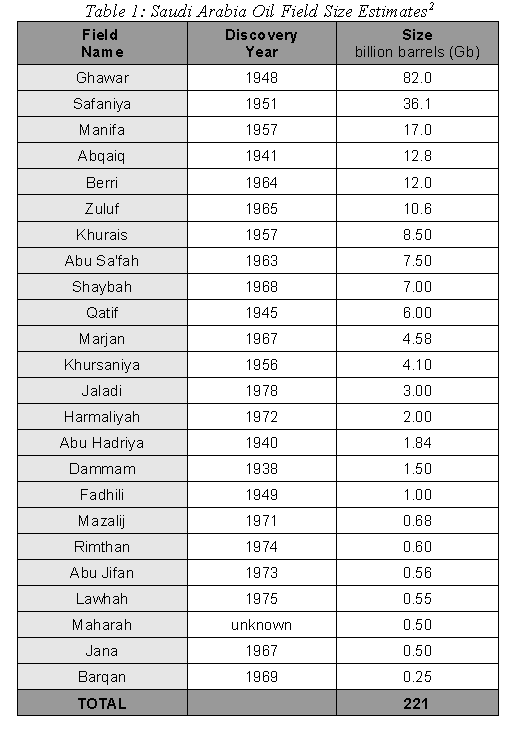
In their 1986 study “Giant Oil and Gas Fields”, Carmalt and St John (American Association of Petroleum Geologists2) published a list of the largest five hundred oil and gas fields known at the time. This included field size estimates for 24 major fields in Saudi Arabia (crude oil and condensate).
Unless otherwise stated, reserves here refer to P50 estimates, ie. proven plus probable (2P)
Gb = Billion Barrels
In SPE Paper 255803, Saudi Aramco reference this Carmalt and St John paper when they claimed that the Berri field “ranks as the 22nd largest in the world”. While this does not specifically endorse any of the reported field sizes, that Saudi Aramco have seen fit to reference this paper provides it with a significant level of credibility.
It is also important to note that Carmalt and St John, using a variety of sources including industry databases, performed their study before the widespread revision of OPEC reserves in the 'quota wars' of the mid/late 1980's. This suggests that the data they were using would have been free from any of the 'political pollution in technical databases' which Jean Laherrere has roundly criticised more recently.
Stuart's analysis1 revises the field size estimate for Ghawar up to 96 billion barrels (Gb). Some of this increase may have occurred in the southern sections of Ghawar, especially Haradh which has only been extensively drilled and developed since 1986. It is significant that, despite this additional development, the total field size estimate has only increased by 17% in two decades. Euan's base case analysis4 revises Abqaiq reserves to 14.8 Gb, which represents a 16% increase on the 1986 estimate.
That the Carmalt and St John estimates are only modestly lower than these two new estimates, is encouraging, but not all that surprising given that most of the listed fields were already 20-40 years old and extensively developed by the time of their study.
While some fields may come in below the 1986 expectations, which is to be expected among a mix of P50 estimates, others may yield yet larger percentage increases. At this stage it is reasonable to extend the observed average increase to the other 22 fields in the list. While this is based on results from only two fields, the sample covers 43% of the resource so it is quite significant. The result is in an additional increase of 21 Gb in the size of the other listed fields (in addition to 14 in Ghawar and 2 in Abqaiq), bringing the revised sub-total to 259 Gb.
The cumulative additional resource in very much smaller fields and those discovered since 1986, of which the Hawtah trend fields are the only known significant oil find, are estimated to amount to 6 billion barrels.
This yields a total initial reserves estimate for Saudi Arabia of 265 billion barrels.
Cumulative production of crude oil and condensate to end of 2006 is 113 Gb. Therefore, 43% of initial oil reserves have been produced, with end 2005 reserves of 152 Gb (2P). This is more than 110 billion barrels short of the 264 stated by OPEC and widely reported as Saudi Arabian 'proven' reserves (although 264 includes an amount of NGLs also).
Coincidentally, there is a close match between Saudi claimed reserves and the initial reserves in this analysis. This tends to support a claim made previously by Colin Campbell that in the OPEC 'quota wars' in the 1980's, some members started reporting initial rather than current reserves. This makes some sense in the context of allocating quotas, rather than haggling over production revisions each year. But there is no official confirmation of that interpretation, so we can only conclude that OPEC reserves are substantially overstated. It's only a pity that these are the most widely quoted figures for the countries holding the largest share of the world's most important energy commodity.
However, even the dramatically lower reserves figure of 152 Gb may seem high to those with a pessimistic view of Saudi resources. While we may question recent claims that Shaybah has over 20 billion barrels of oil, the figure of 7 Gb reported by Carmalt and St John still seems robust. The growth increment applied here to their figures appears justified but even discounting that, the evidence does not support an initial reserves estimate of anything less than the 221 Gb estimated in 1986, given that Ghawar and Abqaiq estimates alone have now come in a combined 16 billion barrels higher.
1979 US Senate Commitee Report
The 1979 staff report to the US Senate Subcommittee on International Economic Policy on "The Future of Saudi Arabian Oil Production" supports the figures in the 1986 Carmalt and StJohn paper. Aramco (prior to nationalisation and operating in line with standard US industry practice) estimated to the Senate Subcommittee that Saudi Arabia had 2P reserves of 177 Gb and 3P reserves of 245 Gb (proven plus probable plus possible).
Cumulative production to the time of the report was 35 Gb, so the corresponding initial reserves estimates were 212 Gb (2P) and 280 Gb (3P). Seven years later, Carmalt and St John's combined assessment was 9 Gb higher, which provides confirmation that their field sizes were close to consistent with Aramco's best estimates at the time.
Even including NGLs, it is impossible that minimum initial reserves of 384 Gb could be valid, but that is what Saudi Arabia imply now with 120 Gb of cumulative production and 264 Gb now claimed as 'proven' reserves. On the other hand, it is encouraging that the new figure presented here (265 Gb) falls within the range identified by Aramco in 1979. After three decades of field development, it is perhaps not surprising that the new estimate falls in the high end of their range, but as the fields mature the opportunity for further gains diminishes.
While reserves of 152 Gb are well below official statements, it is still an enormous volume. However, not all barrels are created equal and this analysis in no way implies that Saudi Arabia has the ability to maintain higher levels of production. As Matt Simmons states repeatedly, it is clear that the high quality, high flow rate fields which have been the mainstay of Saudi production are now very mature. While production from these fields may be declining, there is still a large remaining resource of lower quality oil that is more difficult to produce. Saudi Arabia may never sustain crude and condensate production of much more than ten million barrels per day, but they do have the resources to support flow rates of half their current level for several decades.
Because production has been limited to well below the theoretical Hubbert profile (fig 1), the large and conservatively exploited initial reserves base of 265 Gb allows for a relatively modest 2% long-term average annual decline. Crucially though, this analysis and the chart presented in figure 1 have no immediate predictive ability with respect to production. This analysis only indicates that reserves are sufficient to support a moderate production level well into the future. In the near-term, Saudi Aramco is engaged in an epic struggle to offset declines in mature fields with new production from several large field re-development projects over the next five years.
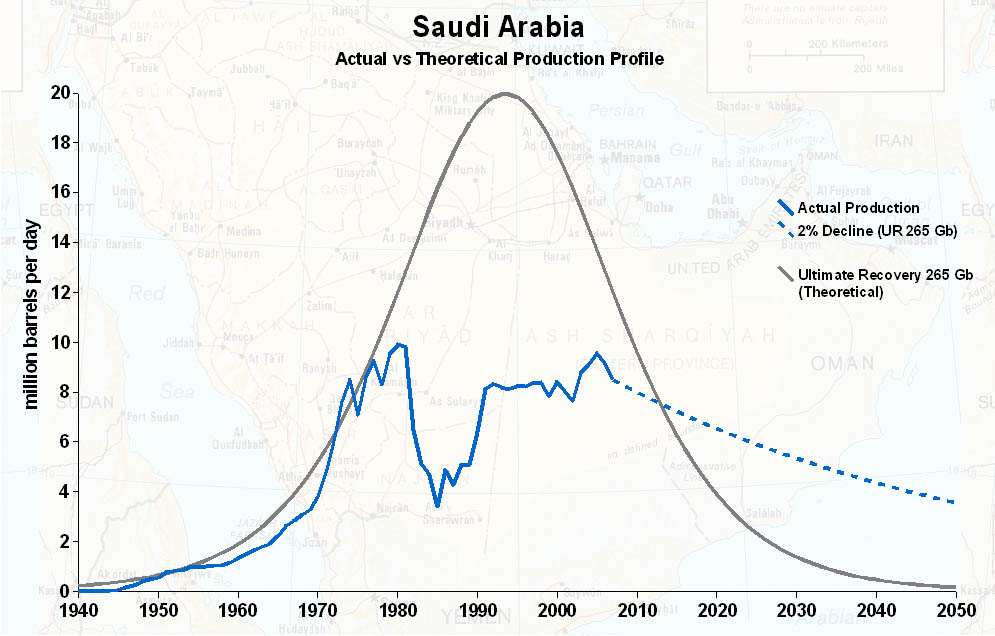
Figure 1: Saudi Arabia - Actual Production vs Theoretical (Click to Enlarge)
One interesting interpretation of Figure 1 is that some kind of oil crisis in the 1970's was inevitable. World consumption and Saudi production was growing at a breathtaking but unsustainable rate. The crises in 1973 and 1979 served to drastically cut consumption and it wasn't until the Chinese and world demand surge 25 years later that Saudi Arabia again reached its resource and capacity constraints. If they do succeed in regaining higher production levels, it will only ensure that future decline rates are greater than 2%.
OPEC Reserves
Importantly, it is not only Saudi Arabia for which there is evidence that reserves have been grossly overstated. Quoted reserves for the six largest OPEC members, and large upward revisions during the 1980's in particular, give cause for concern. The International Energy Agency5 has supported this interpretation, saying that “the hike in OPEC countries’ estimates of their reserves was driven by negotiations at that time over production quotas, and had little to do with the actual discovery of new reserves.”
More revealing is recent IHS data, in this case specifically for Kuwait6 (fig.2). This suggests that Kuwait's reserves are barely half the 101 billion barrels reported publicly. Further confirmation comes in the IEA’s definitive World Energy Trends 2005 – Middle East and North Africa (MENA)7. They estimate remaining proved and probable (2P) reserves in Kuwait (including half share of Neutral Zone) at 54.9 billion barrels from 9 named and two 'other' fields. For the UAE, proven and probable reserves (2P) are put at 55.1 billion barrels from 9 named fields and one 'other'. These estimates for the end of 2004 are sourced from IHS Energy and IEA databases.
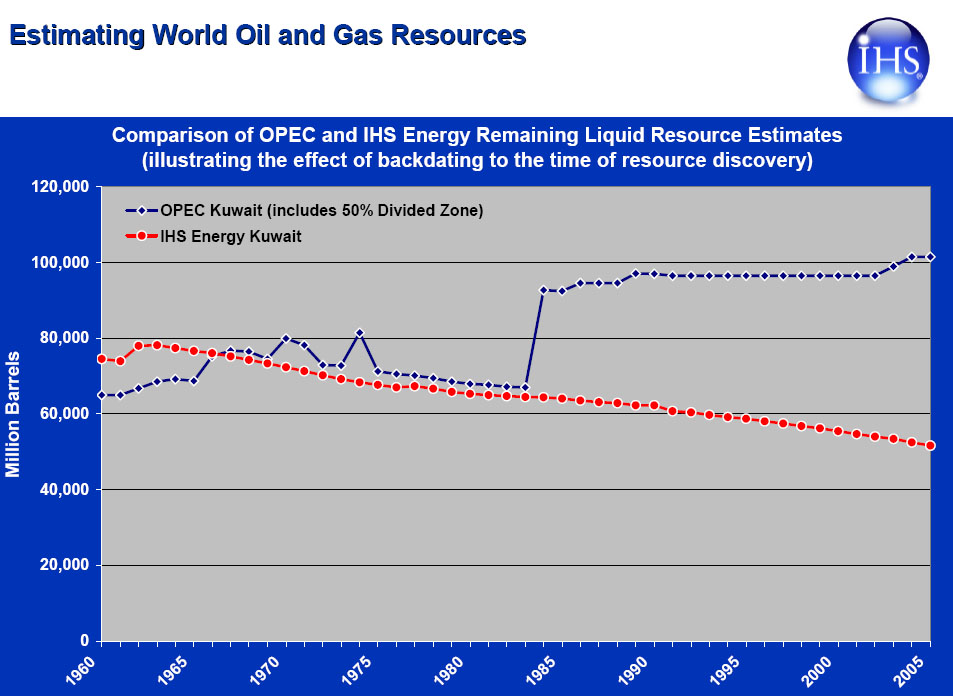
Figure 2: Kuwait Reserves – OPEC vs IHS (Click to Enlarge)
It is almost certain that reserves in Iran, Iraq and Venezeula are overstated to a similar degree. Reserves for other OPEC members Algeria, Indonesia, Libya, Nigeria, Qatar and now Angola appear somewhat more realistic, although these are still are not provided with any form of audit or verification that they meet external reporting standards.

Claimed OPEC reserves are overstated by approximately 340 Gb. They are, with a high degree of certainty, rather much closer to 570 billion barrels than the 904 claimed. Combining this with the Oil and Gas Journal's non-OPEC conventional oil reserves estimate of 280 Gb9, yields a global reserves base of 846 billion barrels, well short of the 1140 level assumed.
The implications of this circa 340 billion barrel reserves shortfall for global forecasts of petroleum supply cannot be overstated. With cumulative consumption at 1180 Gb10 and reserves of less than 850 Gb, we have consumed well over half our conventional oil reserves base.
With those kinds of numbers, peak oil cannot be far away, and exploration and 'reserves growth' will not be enough to get us out of the woods.
This article is available as a PDF here.
Previous Articles:
Depletion Levels in Ghawar (Updated)
GHAWAR: an estimate of remaining oil reserves and production decline (Part 2 - results)
Abqaiq and Eat It Too (or, More Geological Analysis of Potential Saudi Depletion)
Try these tags for other relevant articles at The Oil Drum:
Ghawar
Saudi Arabia
OPEC Reserves
Reserves Growth
References:
1. Staniford, S., Depletion Levels in Ghawar. http://www.theoildrum.com/node/2470 (May 16) 2007.
2. Carmalt, S.W. & St. John, B., Giant Oil and Gas Fields, in Harbouty, M.T., ed, Future Petroleum Provinces of the World: AAPG, P.11-53. 1986.
3. Kompanik, G.S. et al., Geologic Modelling for Reservoir Simulation: Hanifa Reservoir, Berri Field, Saudi Arabia. Society of Petroleum Engineers (25580). 1993.
4. Mearns, E (2007) GHAWAR: an estimate of remaining oil reserves and production decline
(Part 2 – results). http://europe.theoildrum.com/node/2494 April 28, 2007.
5. International Energy Agency, World Energy Outlook. 2004.
6. Chew, K. (IHS), Oil Depletion – dealing with the issues. Energy Institute Nov 2006.
7. International Energy Agency, World Energy Trends 2005 – Middle East and North Africa. 2005.
8. Organization of the Petroleum Exporting Countries, Annual Statistical Bulletin. 2005.
9. Oil & Gas Journal, PennWell Corporation, Vol 104 Issue 47, 2006.
10. Jackson, P.M. (Cambridge Energy Research Associates), Peak Oil Theory Could Distort Energy Policy and Debate. SPE Journal of Petroleum Technology Feb 2007.
Contact
- anz at theoildrum dot com
License

This work is licensed under a Creative Commons Attribution-Share Alike 3.0 United States License.
Archives
- November 2010 (2)
- October 2010 (5)
- September 2010 (4)
- August 2010 (8)
- July 2010 (2)
- June 2010 (2)
- May 2010 (6)
- April 2010 (7)
- March 2010 (12)
- February 2010 (11)
- January 2010 (7)
- December 2009 (10)
- November 2009 (6)
- October 2009 (7)
- September 2009 (10)
- August 2009 (10)
- July 2009 (3)
- June 2009 (14)
- May 2009 (10)
- April 2009 (15)
- March 2009 (16)
- February 2009 (16)
- January 2009 (15)
- December 2008 (15)
- November 2008 (23)
- October 2008 (25)
- September 2008 (24)
- August 2008 (30)
- July 2008 (44)
- June 2008 (38)
- May 2008 (48)
- April 2008 (43)
- March 2008 (29)
- February 2008 (32)
- January 2008 (30)
- December 2007 (26)
- November 2007 (32)
- October 2007 (11)
Very good paper. Different orthogonal methodologies lead to reserves in the 140 - 175 Gb range for Saudi Arabia.
You can maybe add that with a reserve base of only 140-175 Gb, it is impossible to go above current production levels. Using Pickering relation (http://www.theoildrum.com/node/3221), you get a maximum production between 6.62 and 8.25 mbpd.
thanks Khebab.
I would also note that JoulesBurn, whose Saudi satellite sluething is simply amazing, thinks that Stuart's and Euan's estimates of OIIP for Ghawar are too low because of an under-estimate in the field area. However, I don't think that materially affects the analysis here.
Using Kebab's numbers and the "Pickering Relation".
140 / 6.62 = 21.15
175 / 8.25 = 21.21
The average multiplier is 21.18. Saudi Arabia claims they will increase production to 12.5 (mbpd). So we multiply 21.18 x 12.5 to get 264.75, which is the reserve number the Saudi's claim.
You are correct, 12.5 mbpd implies the following reserve numbers:
Fringe (large non-OPEC extractors): (12.5 -0.093)/0.0466= 266 Gb
Small Fringe (small non-OPEC extractors):(12.5-0.0418)/0.0435= 286 Gb
OPEC: (12.5 - 0.2323)/0.0096= 1.3 Tb (sic)
The last number is outrageous because the OPEC relationship is based on the official inflated reserve numbers.
I am trying to get a sense of what all this implies. I am assuming that Pickering's empirical numbers give a sense of prudent flow rates from a reserve of a given size. So then 12.5 mbd would be a prudent flow rate if SA indeed had 264 Gb reserve. So if SA only has 152 Gb as the article above says, then is the flow rate that SA is trying to achieve imprudent? What is the effect of pumping a reserve at imprudent rates?
Steeper decline rates, basically Cantarell all over again with 15% or greater production losses..
i dont see how an emperical relationship between reserves and rate in any way implies a prudent flow rate.
I'm no expert but I believe the prudent flow rate is the one that gets you the most amount of oil is the long run.. If you pump too fast you will end up leaving more oil in the ground by depleting the reservoir pressure to fast..
"I believe the prudent flow rate is the one that gets you the most amount of oil is the long run.."
i dont disagree. but my point is that there is no way, short of a (impossible given the lack of data) thourough analysis of each and every case in the data base, to conclude what a prudent rate for a group of producers is from an imperical analysis.
a mer(maximum efficient rate) determination also has an economic component and thanks to a (usually) constant oil price assumption and discounted present worth analysis leads to higher, rather than lower production rate. sometimes to the detrement of ultimate recovery*.
in the us of a, rule of capture .......well......rules, that has lead to excessive wells being drilled, rapid depletion and ,imo, loss of reserves.
* the only case where a higher rate may result in greater recovery is in a water driven ng reservoir.
Thanks for your support :
http://www.reddit.com/info/6kxqw/comments/ (sci)
http://www.reddit.com/info/6kxu5/comments/ (business)
http://digg.com/general_sciences/Oil_Reserves_Where_Ghawar_goes_the_rest...
Something I have learned from talking to folks from other websites is this: if you get coordination from your readers, getting them to vote for your materials at the linkfarms such as reddit, digg, and SU, you increase your site's traffic numbers by incredible numbers.
It is not that hard to do. SuperG added a "ShareThis" button at the bottom of each one of our posts, if one has an account on these services, all one has to do is go in there and click the particular service (you may also have to login if you have not already). If the post has not been submitted yet, it will submit it--if the post has already been submitted, it will give you the chance to vote it up. Simple.
So, folks, please help us out, click the above links or the "share this" button and vote up our work each time you can. It helps us get more eyes, which means more ad revenue to support the site.
All we need is about 65 people to digg this story, and that will result in about 4500 new sets of eyes to the site. Make it happen.
Update: 17 DIGGS AS OF 5p EDT. Come on folks, try to get it to 25 so it at least gets seen. 65-ish will get it on the front page. We have 24 hours to get it on to the front page from the time of submission.
4:52 ET
I was Digg # 17
Reddits Sci 22 and Bus 11
I think the Goose is onto something.
Yes, it works cowpoke. I would think that with 25000 visitors a day we could get 65 folks to click a button--somewhat habitually. Perhaps not.
".....some members started reporting initial rather than current reserves."
i think this is the crux of the matter. and maybe something is lost in the translation(from arabic to english). oil that is already produced cannot by any stretch of the imagination, or of the definition of "reserves", be considered reserves.
oil reserves are the quantities of oil remaining to be produced(period)
of course ksa can apply any definition they like, but it doesnt change reality.(imo)
But they think allah will replenish the oil (that is true btw). After all, he will never ask them to do more work (he does indeed promise that in the quran)
The bible promises them however that the arab cities will stand "as great empty mountains near the sea".
I wonder who's right. (not that I'm implying God has anything to do with this)
AFAIK that 1180Gb figure is global consumption, but the 850Gb figure is only OPEC reserves, not including nonOPEC (from your table). So its not necessarily true to say we've consumed well over half if you don't add in the nonOPEC reserves as well.
But non-OPEC reserves are included in this number (846 Gb). Have you read the whole report?
Oops, read the wording above incorrectly. Sorry.
846Gb still seems a low estimate to me for global reserves, I guess it doesn't take into account the 'yet to finds'.
Be it 846Gb or 1Tb - its not going to make much difference to the possible rate of extraction.
Hubbert found, in 1956, that a one-third increase in URR for the Lower 48 delayed the projected peak by all of five years.
Has anyone done a similar estimate for global production? I think that would be a very useful talking point.
here's a yabut: yabut "yet to finds" are not reserves either.
1 Tb left for conventional oil seems reasonable if you assume a discovery rate of 11 Gb per year until 2030 (this discovery rate is the average rate observed for 1996-2006). In addition, you have to add 180-200 Gb of tar sand reserves but the flow rate to reserve ratio is very low for this kind of resource (at least 3 times smaller than for conventional oil) so this reserve number should not be added to the conventional one.
850 billion barrels is low for reserves; that's why we have a problem! :-)
and of course reserves don't include what is still to be discovered. khebab's given a decent estimate for that. reserves also don't include the amount that existing fields will grow as extra effort is applied. i had a stab at estimating that amount here:
http://www.theoildrum.com/node/3301
hell that would be 58% produced total. Way over th 50% in hubbert's models and if correct it looks like overproducing globally by technology and the steep cliff is coming soon.
My guess is that the Saudis are only maintaining their current production rate by pushing some of their older fields harder than they should, and as new wells come on line they will be curtailing high water cut production.
We shall see what the annual 2008 data look like, but I expect that 2005 will prove to be their final annual peak production rate. Meanwhile, the net export picture does not look good, and the volume of total liquids that they would need to produce, just to match their 2005 net export level, increases with time. I estimate that if they wanted, and were able, to match their 2005 net export level, they would have to boost their 2008 production rate to about 11.7 mbpd (total liquids) versus 11.1 in 2005.
BTW, the long term decline rate from the prior swing producer, Texas, was -4%/year, twice the overall Lower 48 decline rate--despite very aggressive driling and secondary/tertiary recovery programs.
This seems to support the theory that Saudi net exports will dry up between 2030 and 2035, based on 4% consumption growth.
No argument from me.
Well I've been thinking about export land and it does have a upper limit. A good number is 2X American consumption or inline with consumption of some of the wealthier Arab emirates.
For the US
http://www.eia.doe.gov/pub/oil_gas/petroleum/analysis_publications/oil_m...
This gives 3 gallons a day or 20 barrels a year for Saudi lets assume they are a bit more wasteful and to make calculation easy say its 30 barrels a year or with a bit more about 1 barrel a month per capita.
http://en.wikipedia.org/wiki/Saudi_Arabia
Lets put Saudi population at 30 million people this gives at 1 barrel a month per capita or about 1mbd.
Well never trust the EIA or I made a mistake :)
http://en.wikipedia.org/wiki/Petroleum
This gives 75 barrels a year or 6.25 per month for Saudi Arabia which just thinking about gasoline usage oil fired electric plants import etc seems more realistic to me. Or 0.20 barrels a day or 6mbd per year.
Which is interesting since we know current consumption is less I think about 4mbd but in any case clean up this approach a bit and it seems reasonable to expect Saudi consumption to peak at around 6mbd or so.
In any case oil consumption should approach some maximum level per capita and probably the growth rate will undergo a exponential decline as more Saudi's reach the maximum use level.
This does not change the overall nature of export land but instead of exports going to zero for Saudi Arabia depending on the usage pattern it looks like a more realistic answer is they would go to 1-2 mbd or so.
Iran with its much large population would go to zero. Some countries like Nigeria which is not investing in internal consumption/growth probably will continue to export at significant levels.
I don't think this changes the overall problem of export land to any large degree but I think that dealing with maximum per capita consumption as a cap on export land makes the longer term forecast more realistic.
You also of course need to continue exports to make money until or unless the economy is self sufficient. For example in the US it made more sense after a while to use the oil internally and export finished goods.
I don't know the state of the various gulf economies but this adds another cap to export land.
Iran for example cannot go to zero exports given their current economy same in my opinion for Mexico.
This just trades the export land problem for a more potent and politically volatile situation where internal consumption will be limited to ensure exports.
And of course the dollar peg used by a lot of these countries introduces its own problems. And over the next few years as global peak becomes more accepted we would expect internal pressure to limit exports to build.
The net result is export land is probably optimistic even though in a few cases its probably overstating the rate at which internal consumption would increase. Actually it makes more sense for OPEC to limit production even more than they are to force a high price regime so they can use the money to convert their internal economies to a more stable and sustainable form with raw oil exports aggressively decreased and internal demand moderated. Note that moving to nuclear powered electricity is probably the most sensible move they could make along with widespread use of electric rail. The world in general would be better off helping these countries build robust economies with a more reasonable finite oil consumption level that leaves enough for export so the rest of the world can also transition.
I think the point is, that in 20 years, the US will have to learn to get by on 7mbd of $800 bbl oil. Ouch!
Not sure they have 20 years.
I think the whole fiat currents/growth oil economy will have to reorganize fairly quickly once we are down 5mbd + in production. In any case Peak Oil is only one of the factors which is pointing towards the consumer becoming a endangered species. However it seems to be the one that will in my opinion force us to change.
The sad thing as peak oil progresses our options for making a enlightened change with the least amount of disturbance. And worse the chance for significant changes in production rates coupled with export land pretty much ensures that this 5mbpd+ point will be reached sooner than later.
So far at least the world seems determined to ignore it and allow it to build into a real political problem.
All major wars in the past where preceded by strong political tensions so this is the danger we are facing.
WWI can be viewed as the end of the colonial period. WWII pretty much grew out of the results of WWI coupled with the depression. Our current condition can be viewed as the end of globalization which is really just another colonial expansion coming to a end. Its easy to treat the fall of the USSR as equal to the first world war and the current situation as a eerily similar set of events which resulted in the second world war.
The US surprisingly seems to be taking the role of Germany even though Russia technically lost the cold war.
This twist in roles is interesting makes you wonder who really lost the cold war.
Best guess when do you estimate that we will be down 5mbd?
Export Land is raising havoc with any hard estimate. Also the last claims of production increases since December seem to be totally bogus from what I can tell.
But the model is that post peak production takes the form of a forced logistic function which gives rise to a step like production pattern. You can see this in US production which is what I call weakly forced with small steps not far from the logistic estimate. If you look at recent US production its diverged from the unforced logistic by quite a bit. So the first assumption is that US GOM production will drop off rapidly this year say by 500kb - 1mbd over say the next 18 months. This is the first strongly forced step in US production so its hard to say. But once the step like pattern starts you tend to diverge from the logistic then drop rapidly back to it recover diverge drop etc. The forcing function on US production just changed after the prices went up and we have not really fallen off but eventually when it does fall it should fall back to the logistic or below.
So GOM is one of my hotspots.
Ghawar is another one and the thesis is and has been that the water cut problems are primarily in wells behind the water front and its production from bypassed pools. I've got no way to know this but from other fields we can assume that this is good for only about 4 or 5 years at most of production at a high production rate.
This is another 1-2mbpd thats may be at high risk.
The rest of the potential problem areas are scattered throughout the world primarily in small offshore fields that have been developed since the 1990's that should begin to decline rapidly. Same problem as the GOM but its scattered everywhere.
Finally on the good side is China and Russia should stay close to logistic or have room to push production if they choose to.
Other high risk increments are of course in the North Sea and Mexico. The uncertainty is large but 15mbd of high risk production seems reasonable just looking at different regions. This is production that could decline at 10% or faster effectively now. Next the assumption is that is a flat decline rate not a percentage of remaining because overtime more areas enter the high risk group as fields in the group decline.
So basically replacement. At 15mbd this gives say 1.5- 2mbd of steep declining. The high end is 30mbpd is in this high risk group giving about 4mbd declines. This is on top of any overall base decline and replacement that kept us at plateau to date. So right now on the production/storage side the tentative guess is basically 1-2mbd drops every 4-6 months.
The expectation is we probably are already in a high risk decline which is being reflected in price but not yet in public production. So we should be at least down 2mbpd by the end of the year. Price indicates we are already down something like 700kb-1mbd right now so at least for 2008 we should end the year down 2mbd.
Given this export land seems to be removing about 2mbd from exports already. But now you see why its tough to figure. Export land could account for almost anything give we don't have good production numbers.
However export land should be signaled as a relentless but steady increase in price since its basically a steady growth in declining exports. While production problems coupled with draining storage should give more erratic large jumps in price. The assumption is that export land is driving the steady upward movement and larger price swings are reflecting steps or stairs in real production vs storage levels.
So export land is setting a ever increasing floor and production problems are driving the new highs.
Sorry for moving to price but it looks like real production data as bad as it is has gotten a lot worse over the last year. So now to answer your question if I'm right then we should see 200+ a barrel by the end of the year with the combo of export land and production drops plus global storage pull downs putting us firmly past a 5mbd drop in exports with no way to refill storage globally by sometime in 2009. My next assumption is its only going to get worse and next year or so we will go into a higher 4mbd constant decline sending prices into the 300-500 dollar a barrel range by late 2009-2010. Export land keeps up the relentless pounding say 2mbd year in and year out. By late 2010-2011 we should be seeing real shortages.
Now to offset all this is price does drive supply demand and a number of large projects where supposed to result in a flood of oil so even though I don't see any indication of this flood showing up it will moderate stuff over the short term. But I don't see it offsetting the combo of real declines and export land. One but not the other. Down 5mbd puts us into danger of persistent shortages and the resulting sharp jump in prices to as high as needed to cause real demand destruction. So my best guess is we will be down 5mbd in exports for sure by late 2009. If we do get some oil online then we would stall at 200+ on the prices say in late 2008-2009. Either way I think its going to around 200 by the end of the year but new production will provide a boost for about six months or so before the combination of export land and production declines drives us back into the permanently low storage condition.
However we are almost into June or 6 months through 2008 and no flood yet enough project where supposed to be coming online that we still have a good chance for a bit of a breather.
Sorry for all the handwaving but until we see the first few production steps appear for real and the global data gets corrected its hard to say. However once we get a clear step pattern then we can expect the next drop to be at least the same ( unless its different :)
So to wrap up production should have shown basically a 1mbpd step down starting in about November of last year. We should be I think starting on the next 1mbpd step down and they look to last about 4-6 months from the price data. So another price spike in Sept plus a summer one. Figure 30 dollars a barrel for each run and you have 60 on our current 130 putting us at 190. Throw in a dash of export land adding say 50 dollars a barrel and you get about 240 say 6-8 months from now. This is saying that export land is giving a 6 dollar a barrel increase about every month day in and day out. So given last years price at 70 export land alone would have put us at 140 by the end of the year. In 2009 export land adds say 12 a month like clock work.
So thats 240+144 = 384
Depletion is adding in it looks like another 100 a year.
So 384+100 = 484 by end 2009.
Back off a bit to allow a production slug that should help some puts us at 300-350 by end 2009.
It seems to day we have seen oil prices double every year so that puts us at about 240 or so end 2009 just using past data. I think 300 is a sure bet and if I'm right its going to be closer to 400-500.
I think my arguments for how export land and production effect price are pretty good. So you just have to watch how price moves over the next several months to deduce the real cause for changes. Eventually production figure will catch up with the price signal and we can see if I'm right. I think once peak oil is more public reasons to fudge production will decline and the production data will line up with price.
Now going forward somewhere around 500 a barrel we should begin to see real demand destruction so overall we should get a bit of a breather until we start hitting critical use issues then its off again to god knows what but probably 800+.
The US could say lose 5mbd in demand before we hit a wall. Europe say 2mpd. Japan probably the same. China/India should stop or really slow their growth at that point. But as we pass the 10mbpd down mark we are entering into impacting very inelastic demand such as farming, food transport etc. My SHTF date 2011-2012.
The 10mbd+ zone is where we see real and serious problems develop. The US could say drop yet another 2-3 mbpd
Europe 1 India/China say 2mbd but you can see that we are to the point that further demand destruction is really disruptive.
And sorry for the long post of WAG's but the first 5mbd looks blown using production data so price is the only guide. The second 5mbd downleg should have decent production data and hopefully this years production data may be revised giving us good but dated data.
A very interesting post Memmel, using world wars in relation to the end of time periods, and in particular Peak oil causing the end of globalization. I find it fascinating that the globalized economy didn't get up to speed and fully connect for many years before the onset of peak oil. Really, just a sliver of time before it will apparently go back to a more regional or even community (Kunstler) based economic structure.
Who lost the cold war? That's another good one. Maybe both parties were destined to lose that epic battle, just at different times, yet with both having the same cause; unsustainability.
http://www.jodidb.org/IEFS/TableViewer/tableView.aspx?ReportId=131
here's all of 2007's data, and 2008 up to march. saudi production looks to have gone up somewhat from the declines of 2006. this is encouraging since it seems like the saudis still has some life in them (iirc khursaniyah project's 500k mbpd is still being delayed so hasn't been chipping in yet, despite being slated for going online in late 2007)
IMO, a key difference between Saudi Arabia and Texas is that the Saudi's largest field accounted for a far higher percentage of total production in 2005 than did Texas' largest field in 1972 (the East Texas Field). I suspect that a rapid increase in water production from North Ghawar took them by surprise and it took them a while to frantically try to bring on new and inactive fields.
In any case, in 2008 if they were to exceed their 2005 C+C production rate of 9.6 mbpd, they would probably have to boost production in the second half of the year to 10 mbpd (C+C). So, IMO, it is more likely than not that the Saudis will show three straight years of production below their 2005 rate of 9.6 mbpd.
obviously i agree that saudi aramco are not going to be doubling their production rate in the next ten years to save us :-)
but even i was surprised that they were able to increase production substantially in the last six months, before khursaniyah came online.
they might be struggling, but you have to be impressed with what they are capable of.
The initial Texas decline was pretty low. Rounded off to the nearest 0.1 mbpd, the numbers looked like this (1972 was peak):
1972: 3.5 mbpd
1973: 3.4
1974: 3.4
The initial Saudi data are as folllows:
2005: 9.6 mbpd
2006: 9.2
2007: 8.7
(C+C in both cases)
When Stuart did his 8%/year decline rate article on Saudi Arabia early last year, this is one of the reasons that I suggested a future rebound in Saudi production, to a level below their 2005 rate. Basically, I think that the North Gharwar decline took them by surprise, and it has taken them some time to regroup.
But I see almost no chance for Saudi Arabia, in 2008, to match or exceed their 2005 annual rate of 9.6 mbpd (C+C). If the 2008 annual rate is below 2005, it would be three straight years of lower production, relative to 2005, and we would then be looking toward 2009.
So, just as I advised people not to read too much into the initial Saudi decline rate, I would be cautious about reading too much into the recent rebound. The key is average annual production, as depletion marches on.
I find that very interesting. where there any signals in the price or production stats?
Boris
London
I think there was a signal in oil prices, Matt Simmons is talking about it in his book.
I never knew that. So history (events) .or... " the above ground factors" didn't quite short circuit the pressure as it where.
But did to a degree only hindsight can see it.
I wonder what our history is going to look like in 50 yrs and how it will be interpreted.
remarkable
Boris
London
For Ghawar and in fact many of the fields in Saudi Arabia one has to question even the conservative reserve estimates. Ghawar has been under peripheral water injection since early in the life of the field.
Here is a fairly good overview.
http://www.searchanddiscovery.net/documents/2004/afifi01/index.htm
It has
Oil discovery: 1948.
On stream: 1951.
Peripheral water injection: 1965.
Oil production: ~ 5 million B/D from Jurassic Arab-D.
One interesting fact.
The water-cut increased from 26% in 1993 to 37% in 1999, but it decreased afterward to 33% in 2003.
And to get to my main point since primary and secondary recovery have been mixed since early in the fields life and it uses and approach thats uncommon we can expect that reserve estimates especially recoverable reserves at high production rates may be high.
In my opinion we should expect at some point for final water breakthrough to happen in the Ghawar field from this point onwards the field would produce at a low oil production rate and high water cut. Given that the infrastructure in place at the field is too my knowledge not designed to handle high water cut extraction one would expect production to undergo a steep decline until the water handling capabilities where increased.
This may well be already happening at the field I don't know. The point is that when making URR estimates using field data and then combining these to get and overall production estimate ignoring what I would consider a common sense prediction of Ghawar's output and in general most fields driven with peripheral water injection will probably lead to a high estimate for both real final URR and the production profile as the field passes into decline.
Given that Ghawar's first water problems where over 15 years ago I can't see them not returning.
And example using different technologies but what I think represents a similar profile for a technically driven large oil field is Canterrel which went through a series of technical innovations with nitrogen injection that allowed production to remain high until a final steep decline.
I know of no field that was aggressively extracted with primary and secondary recovery applied early or extensively that did not eventually undergo a steep decline.
Given how much Ghawar contributes to KSA's production a serious look into the ramifications of the water injection program for both production rate and final URR is probably important.
So?
1) Ghawar, without peripheral water injection, probably wouldn't have been able to maintain 1Mb/day production, much less 5. We wouldn't be having this discussion.
2) There is no evidence that power water injection has led to any less recovery than would have been possible without it -- it just came out faster.
3) We don't know (both for original estimates and for more recent revisions) what goes into their reserves calculations. Building on the knowledge of the reservoir areal extent and thickness, porosity, and initial and final water saturations, (and volume factor), you come up with a certain amount of oil. Perhaps you don't have good information on the parameters in the full 3-d volume, so there is some uncertainty. Perhaps you exclude some amount which lies in very tight rock.
4) If reserves are revised upwards, we don't know what factors went into this revision. Better knowledge of the petrophysics? New technology that can get oil from volumes that were previously excluded?
5) The oil is naturally forced out of the ground by water pressure on the periphery. Adding to this pressure will speed this up, and the only concern would be if oil gets left behind. In both Ghawar and Abqaiq, there has been some under-running and over-running of water past the oil, and this can complicate things. But it is not clear whether this is because of the production rate or just a result of differing horizontal permeability of the various zones. In other words, it could be an innate result from water moving in from the periphery to replace oil drained from the middle.
6) The use of horizontal or MRC wells is really just an alternative way of dealing with the fact that the water level rises in the reservoir as it depletes of oil. You could either add more injection + separation and keep producing vertical wells, or you can put the wellbore where the oil is and the water isn't. Economic choice
5) I'm not suggesting that production won't go off a cliff, since theoretically it might be possible (using horizontal wells drilled in the right places) to maintain high production with low water cut until the bitter end. Eventually, the recoverable oil is gone -- unless you do something to change the surface chemistry such that less residual oil is stuck in the pores.
6) Unfortunately, this experiment is not repeatable.
So :)
All your statements add up to what I call a risk factor for production rates. Almost all of them indicate the risk going forward is for lower than expected production at some point in the future. This risk factor is not part of simple models of oil production that assume we will be able to produce the remaining oil just like we produced the first 50%. In my opinion we are probably entering a period where the overall level of global production is risky to determine and detailed transparent data is critical. The details matter more now then the overall trend since changes in exports and production by a few percent will have a large impact on price.
thanks JB. great comments.
although it's different when you own a field as large as Ghawar, North Sea operators were not patient enough to go with peripheral water injection. field wide water injection is the more agressive approach and inevitably leaves more oil bypassed at the end of secondary recovery (and it's hard to keep an offshore platform alive on low rates of enhanced oil recovery).
peripheral water injection seems to be the more long-term approach. saudi have over several decades been very conservative about the production rates from their fields. their challenges are getting greater but there's no evidence that they have been irresonsible in their developments so far. they could justifiably claim to be the world's most technically competent oil company. doesn't help us now though..
Well we don't know the answer to this. Maybe maybe not. One thing that early peripheral water injection should do is keep production high until water break through does occur.
But as far as bypassed oil goes it depends on the fracturing. Ghawar has some fracturing problems and probably has a lot of bypassed oil. Given the long time period that water has been injected you probably have had water travel everywhere it could in the field.
This is a pretty good link main Stuarts work.
http://www.zimbio.com/Abdullah+of+Saudi+Arabia/articles/2/GHAWAR+estimat...
I found this paper which looks like a goldmine and I've not seen it referenced before on the oil drum.
http://www.blackwell-synergy.com/doi/pdf/10.1111/j.1365-2478.2004.00473.x
It basically seems to say that the 4D seismic models we have been using may be wrong.
Although scientific it seems to has a distinctive oh shit ring to it that goes against the repetition
of the party line thats in the paper.
Memmel,
It says nothing of the sort, since nobody has been using 4-D seismic in Ghawar for anything.
4-D seismic is making use of changes in 3-D seismic data over time to look for things like waterflood progression etc. Shiv Dasgupta (a rather good Saudi Aramco geophysicist, but not really a rebel) is rather explaining that 4-D won't work in Ghawar because the differences between oil-bearing and watered out areas is too slight.
Also, this paper has certainly been referenced several times on TOD, and most recently served as "the goldmine" for this recent article of mine:
Ghawar Numerology: Drilling in Uthmaniyah
JB
Groan the input data or check data used for the numerical simulations is 4D seismic unless you know they are using something else. I assume well logs also play a large role.
Your right same paper different links. The point is if bypassed oil is a problem or to put it another way early water encroachment. The answer for Ghawar is yes.
One thing the paper mentions that was not in the linked article is that the number of dry wells was 14% in 2004. 67% at water front. So looking at the paper again from a dry hole water front perspective and the modeling data we have I'd say they have a lot of bypassed oil in the field. From the paper I get the opinion this is a problem and numerous papers have also stated this. My only point is that the question that should be asked is how much oil is left in Ghawar that can be produced at a high production rate and how much will have to be produced either at a high water cut or by finding and drilling bypassed pockets.
Horizonontal drilling into bypassed pockets can keep water cut low and production up for a short time. If this is whats keeping production high in Ghawar at the moment then its not going to last for long a few years at most.
So in a lot of ways early water encroachment is not the issue the issue is if they have a good bit of bypassed oil they can identify then they can produce it with laterals and keep production rates high for a few more years.
In fact googling seems to bring up my comment about bypassed oil from earlier.
http://www.theoildrum.com/node/2470#comment-189836
The combination of a water cut problem and fixing it via horizontal drilling is the same as wells that are producing from bypassed pockets. And it does allow you to maintain production rate for a short time period.
So how much of Ghawar's current production is coming from bypassed oil pools behind the water front ?
Well log data is the input to their models. Kringing is used to interpolate between wells. They use 3-D seismic to identify fractures etc., but 4-D has played no role in this. What gave you the idea that 4-D was used for their models?
In Uthmaniyah, a lot of oil is "left behind" in Arab-D zone 2A (at the top) all the way up towards Shedgum. Looking at where they are drilling via satellite images helps to identify where this occurs.
Don't know, but I agree that the next decade will not look like the last one.
My only comment is the well logs don't seem to be working out well for syncing the model. Thus the problem with early encroachment. The reason its early is because the well log data is not doing a good job of keeping the model in sync. The reason is of course fractures. I'm betting that 4D seismic was used and this paper is giving why it failed to work. Its implicit in the paper that using 4D was not working not that they did not try.
The water cut problems imply to me at least attempts to extract from behind the water front simply because the dry wells by definition are in front of the water front. One one hand it seems that bypassed pools is/was a big problem but they where able to rework wells to extract these pools. Its a bit weird how they always word the papers as dealing with a water cut issues instead of simply saying that its extraction of bypassed oil from behind the water front.
I don't disagree about what your saying about Uthmaniyah but I'm not sure we are catching most of the rework of wells behind the water front in the current imagery analysis. This would be using a existing well bore and either redoing the the completion or adding probably short laterals. I don't know for sure but just from reading reworking a well is a matter of weeks or at most a month before you can move on to the next one.
In a field as large as Ghawar this rework and short term production gain can keep production up for some time. This sort of quicker work seems to be something thats hard to pick up what we can see are the larger projects with new wells or major changes. Maybe one of the professionals can tell us how fast various types of reworking of wells can be performed.
Little blurbs like this that I read.
http://copirite.blogspot.com/2005/03/oil-in-utah.html
Indicates to me that it could be as short as a few days to rework a well. But in general such rework does not tend to last long months or a few years at most. From the big picture the combination of where the water front seems to be located and the ability to maintain current production implies that reworked wells are making a pretty large contribution at least for now.
reworking a well can take a few days or a few months. in the case of aramco, i thing reworking means drilling additional laterals. the logistics of that could take a few months to get the equipment on site, a few more months to actually drill and complete a new lateral.
I know I am missing most of the rework drilling in Ghawar, as it is very difficult to identify these from one image. In Abqaiq, I was able to find several because I had a second (albeit lower resolution) image to compare with. Freshly-graded sand is the giveaway.
No such luck for most of Ghawar, so one has to catch them in action. I found two for Uthmaniyah, and one happened to be in an area which got an image update after I first cataloged it. It showed a rig still on the well three months later, as seen here.
I understand your skepticism, but you really should try reading papers more objectively. Often it seems as if you are reading a completely different paper from what is there.
I just ignore boilerplate propaganda in Aramco papers. In a good peer reviewed statements of fact are backed by a paper trail of previously published papers. We have no papers that reasonably show in detail how Ghawar has been produced and no access to the raw data. Each paper does have a few nuggets that is reasonably supported by data in the paper. For Ghawar given the water drive it makes sense they are producing below the bubble point but the assertion of gravity drainage for example is just that and assertion with no supporting papers.
What we do know about Ghawar is that the water front have been causing problems since the 1990's and we do know enough about the way the are producing that the water drive is enough to meet some production goal. The fact that they keep the water drive rate fairly high regardless of the endless problems they seem to have as a result says that they are focused on reaching some production target for Ghawar. Why not drop the production rate in Ghawar down to say 2mbpd or 1mbd ? In any case maybe the problem is if its not supported by consistent facts in the paper or previously published papers I treat it as irrelevant junk or worse slanted propaganda.
Its actually too bad they don't publish all the supporting data for Ghawar since it would be a fascinating read.
Your not just ignoring boilerplate, you are reading things that aren't there. There is plenty of work out there supporting what they say, but you need to buy the SPE papers to read them. Of course there are fluffy statements up front to appease their bosses, but if you're not going to give the paper a chance, why bother reading it?
An alternate view is that their production rate is not causing problems. I don't believe that either, but you have less evidence supporting your claims than they do supporting theirs.
And I think you mean they are producing above the bubble point, or you had better go read some more.
memmel and joulesburns:
"An alternate view is that their production rate is not causing problems. I don't believe that either,....."
if you look at abquiq(sp - help me)though, they have a very high recovery factor, already 70%+ ooip, as i recall. the only way to get that kind of recovery, except in a laboratory experiment, is by producing at a gravity stable rate, imo. now, wouldnt aramco use the same kind of production management, modelling, monitoring with ghawar as has been demonstrated effective in abquiq ?
and i think you meant to say, memmel, that ghawar is producing above the bubble point.
Let's see if we can make the width of this thread tree go to zero!
If you compare the simulation cross sections for Abqaiq and Ghawar as presented here, both seem to suggest fairly uniform, gravity-stable depletion --albeit with different final oil saturation values. Things aren't always that tidy, but in general, the production rate doesn't appear to be too much for the geology to handle. That said, it is true that if you slowed production to a crawl, even problem areas might tend more towards gravity-stable. But the mere fact that oil is produced from discreet centers (wells) means that water flowing in response to the pressure drop might make it there before the oil -- this is true whether you are injecting the water or just letting it flow in naturally from the surrounding aquifer.
Show me a paper for a field not produced using gravity stable production.
These pictures suggest nothing to me since we don't have counter examples.
I'd say the pictures are consistent with the peripheral water injection program but
other than that I'd have to see comparable fields.
I do agree with you that they are probably not pushing the fields beyond what
the geology can handle.
Here is one paper I found the methods differ.
http://www.aboutoilandgas.org/atce/2006/technical/documents/spe1024191.pdf
Gravity stable C02 flooding is very common but not applicable.
"Here is one paper I found the methods differ."
the case study you cite, ratawi is a whole different animal, in terms of the oil properties and reservoir management this field is as different as night and day from ghawar.
ratawi was apparently produced by depletion for most of its life, the upshot being that a mobile gas saturation probably developed within the reservoir. water breakthrough is exactly what i would expect. permeability variations are important also, but imo the main reason for the water breakthrough can be pinned on gas saturation alone. gas, being of a much lower viscosity than the oil is preferentially displaced.
i have seen this many times before. once water breakthrough occurs, increasing water injection just can never catch up with the reservoir voidage with no chance of collapsing the gas saturation. the result is poor waterdisplacement recovery.
now take ghawar. the pressure in ghawar has been maintained more or less continuously above the bubble point. no gas saturation has developed, the viscosity of the oil remains low, displacement is very efficient(at,imo,gravity stable rates).
i dont have any papers to cite other than the bible of petroleum engineering. that would be craft and hawkins "applied petroleum reservoir engineering" first published in 1959. strange how little the science of petroleum engineering has advanced.
and like me, that bible is worn out. i am probably lucky, i dont have as many pages falling out.
I did a fairly through search but certainly a better one could be performed gravity stable C02 injection makes it difficult to find other cases.
I never disagreed about the bubble point mistyped at best. Actually this probably explains why they keep the water drive at the level they do even if its probably resulting in a fairly significant amount of bypassed oil.
If they slow it down then they have a problem with gas. I'd consider this the number one factor controlling how Ghawar is produced. Don't agree that is gravity stable or more to the point no evidence backs the claim.
However :)
http://www.321energy.com/editorials/staniford/staniford051807.html
Ghawar does have gas caps so its not clear that everything has remained perfect. This was because of early
gas injection it seems.
http://satelliteoerthedesert.blogspot.com/2008/01/water-under-gas-cap-in...
So even the claim of producing above the bubble point is suspect given the presence of gas caps no way to tell.
This thread is getting close to zero width your right. But my point stands the problem is these are fairly strong claims and the evidence for them is weak. The other reason I'm skeptical is that they came out in response to Simmons work. I'd love to see a paper that predated Simmons work and explicitly mentioned something about gravity stable production or the bubble point. Real proof would help a lot.
Well lets go back to that.
http://www.theoildrum.com/node/3923
http://www.theoildrum.com/story/2006/8/16/13213/1413
The source of the claim was a propaganda paper rebutting Simmons. We have no chain of SPE papers from the past discussing how they achieved high recovery rates in Abqaiq. 70% recovery from a field is a big deal.
In general the paper trail that does exist ends not with some technical engineering paper but a political report or statement made by to Aramco officials.
However we do have papers in the top link showing excellent recovery for Abqaiq but as far as I know we have this one slice extrapolation is suspect. Given the data 40-50% is probably the right answer. Regardless Abqaiq results probably don't apply to Ghawar as has been discussed.
To my knowledge the claim of gravity stable production is not backed by papers.
http://www.theoildrum.com/node/3665
http://www.theoildrum.com/node/3665#comment-312131
We have been through all this in detail before. No one is suggesting that Aramco is not a top oil company its just he evidence suggests they are not super special as some of the claims made by the top management suggest.
Whats wrong with the simple answer they have about 160GB-200GB of oil located in a fairly small region with the worlds largest oil field Ghawar at 60GB-80GB. This alone makes it the richest oil region by area compared to the rest of the world and even the Middle East. They don't need to make extraordinary claims even what are considered low estimates puts them in the top position.
The large increases in reserve estimates in the past are fairly well documented and explained by internal OPEC politics. The recent claims of how great Aramco is can generally be traced back to propaganda papers targeted at Simmons work initially and recently at peak oil claims in general.
The only reason for dispute that I can see is that the Saudi propaganda machine has been fairly successful.
peripheral water injection will result in fairly steep declines, but it won't be for all of ghawar at once. stuart and euan showed pretty clearly the different stages of depletion in the five different sections of the field.
the day of reckoning may not be far away for Ain Dar and Uthmaniyah, but Hawiyah and Haradh should be capable of current rates for quite some time.
Phil,
My congratulations on your mathematically brilliant analysis, though its implications are thoroughly devestating. Assuming that consumption flattens out at today's 32GB/year, then
846GB/32GB/year = 26.44 years of petroleum left!
Assuming that discoveries amount to only 1/3 of current reserves, this pushes the day of reckoning to 35 years but the Export Land model will eat up what's left long before that.
When natural gas finally peaks, it will probably fall off an even steeper cliff and we have not even factored that in yet.
Somebody should sit our political comedians down gently and give them a very stiff drink before explaining all this to them.
It makes a mockery of the IEA graph showing ME output 'doubling by 2030' while Europe, US and Japan all continue to suck in increasing amounts of oil...
Given ELM any ideas by what date it will be infutable that the wheels are coming off this silly prediction?
Nick.
Thats one way to do it.
But this opens the question of the quality of the remaining reserves. Production rate oil type etc.
Overall the Oil industry has faced a tough battle with declining production rates and this will only get worse going forward. If you focus on say the next five years maintaining a 32GB extraction rate against even a 800 GB
reserve level is questionable.
For example to focus on Saudi Arabia I suspect their claim of 12mbd of capacity is a optimistic accounting trick. Considering that in general Saudi Arabia prefers to not produce wells at a high water cut say 60% or higher they are probably shutting in wells as they reach a water cut they can't handle with their current above ground separation facilities. I'd not be surprised if they actually do have close to 2mbpd of high water cut production shut in right now. However its not really producible or at best can be produced sporadically.
Globally a lot of oil producing regions and fields are entering the problematic production stage where maintaining production rate becomes difficult. Given that the economy and oil prices etc are sensitive to a 5mbpd change in production. Or 1.6 GB a year even a simple review of the production areas indicates we have 1.6 - 3 GB of production globally that could be problematic.
For Ghawar alone assuming a 4mbpd production rate 1.4 GB assuming a 1mbd danger zone or potential for a 1mbd drop or 25% decline over say 5 years you have 0.34 GB at risk. This is of course just a WAG.
You can do this sort of risk analysis in detail for the worlds oil fields but its pretty obvious that going forward on the downslope we face the chance interesting changes in overall production each year depending on the detailed condition of our fields.
thanks tropicalcactus
did you 'digg' it for me too? the more people who read it, the sooner our 'political comedians' will hear about it (plus it took me ages to write!):
http://digg.com/general_sciences/Oil_Reserves_Where_Ghawar_goes_the_rest...
http://www.reddit.com/info/6kxqw/comments/
cheers
phil.
Last year in October, in an Oil & Money conference in London ex Aramco Executive Vice President Sadad Al Husseini presented a paper which showed that reserves are only 900 Gb. Sadad reclassified 300 Gb reserves as "resources". Having worked in an OPEC country, he should know, although he did not specify which countries had overstated their reserves. This is to be interpreted as a warning. More may yet to come.
Oil & Money Conference, Energy Intelligence, Oct 2007, London
http://www.energyintel.com/om/program.asp?Year=2007#speakers
http://www.energyintel.com/om/speakersNew.asp?Year=2007&filename=SadadIb...
The slide show also contains a graph showing a production plateau in the next decade which is impossible if reserves are only 900 Gb. Irish oil geologist Colin Campbell estimates declining oil production using the same reserve figure.
Laherrere had "technical" 2P reserves in 2004 at only 800 Gb, declining from a 1,100 Gb peak in 1980.
http://www.hubbertpeak.com/LaHerrere/Castilla200704.pdf
good point matt.
Al Husseini's 300 Gb is in the same ballpark as my figure, so that gives the argument even more support.
Why does figure one show Saudi Arabia going into decline at only 43% of URR. Current production is nowhere near the supposed theoretical maximum in the figure at 50% of URR.
Is there something unusual about the Saudi oil fields that makes them hard to produce that would cause production to decline earlier and at a lower relative extraction rate than has occured in other countries?
Has Saudi Arabia somehow been denied access to 1970s era technology that allowed Texas and the lower 48 states to delay their peak production to ~50% of URR and at significantly higher relative extraction rate?
Or is there some unwritten rule stating that contributers to the oil drum are not allowed to include a graph of oil production in any country that does not show a projected decline starting now?
Funny you say this since you would expect them to easily be able to reach 12mbpd or more given a 265GB reserve estimate. Despite the claims of control etc the water problems in Ghawar back in the 1990's makes me question attempts to fit this large of a reserve level with the production profile.
But then if the reserve estimates are high claims of conservative production are problematic.
I have my own opinions of course but I agree with you that either KSA will and can increase production now or the higher reserve estimates are wrong. Or maybe that some of these reserves are very problematic and the extraction rates are more inline with non-conventional reserves than conventional.
No matter how you look at it the conclusion of a slow decline seems questionable its probably the one case thats not going to happen.
The decision to cut production back in the 1980's when oil was cheap also fits better with a depletion protocol based on a much lower reserve estimate than 265GB.
Saudi Arabia has not been denied access to technology, which is the problem. Saudi Arabia has very good technology and is sucking out the oil much better than the Americans did, so it will progress through the depletion curve much more quickly.
While I am sure that Saudi Arabia will still be producing oil in forty years, I am not sure that it will be exporting oil in twenty years.
Bubble or no bubble?
The government has been trying very hard recently to bring oil prices down by proposing more margin requirement or restraining off the counter trade. The purpose is to squeeze the speculators out of the market.
Its intention is understandable. The future market has been designed only for short sellers who are producers, to transfer the risk to speculators. If the coming season has no draught, grain speculators lose. If there is a draught, they win. But in the long run, grain price will go down, provided that you believe that the GDP grows forever. And at least in the past 100 years, this is proved that such an assumption is true.
But, there is one technical problem that the CNBC did not pay attention to. It is a simple fact that light, sweet crude peaked at least twenty years ago.
A. The West Texas oil peaked in 1970s. That was why the future market authority found out that the short hedger’s interest of WTI contract producers waned. So they introduced light sweet crude contracts as the substitute. Even though the quality was the same, the short hedgers were able to bring opec oil to make a delivery.
B. North Sea production peaked in 2000. Brend oil is light sweet oil.
C. In the past 20 years, if you check the US government data, all imported oil quality has been going down, year after year, month after month.
D. Since 1980s, the oil price crashed. SA and Opec tried and failed to push the heavy oil to the market. They complained, even today, no one wants their heavy oil.
E. It is the human nature that we use up the good stuff first.
F. Central Asia’s project that is the biggest coming up supply is not light sweet.
G. Last week or the last three months, the long term short hedgers bailed out their positions which pushed 2016 contract higher than spot.
H. No producers, big or small, who have plenty of heavy oil from Canada, Venezuela, Central Asia and Opec, want to short hedge in today’s light sweet oil future market.
Today’s light sweet premium is only $10 to Opec basket price. If the market finally figures out that nobody has a convenient reason to deliver light sweet to the future market, the light sweet oil will command $50 or $70 premium to the heavy oil. When that happens, that is a bubble.
where is ace ? he sould weigh in on this.
Saudi Arabia claimed it had spare capacity including 1 million bod of light sweet crude in January 2008, this seems to include Khurais:
http://www.bloomberg.com/apps/news?pid=newsarchive&sid=aR7UEgivEbls
As they were reported to be suffering decline rates from mature fields in excess of 7% per annum, some or all of this spare capacity might be exhausted by the time they might complete their Khursaniya project in 2009. Project delays were commonplace in this industry.
Since Saudi Arabia has already stated that they intend to practice conservation and expect to reach peak capacity in 2009 at close to 12 million barrels of oil per day. Guessing peak capacity seems relatively easy. Guesstimating how long they can hold that plateau is not as easy.
It seems since the United States can hold 5 million barrels a day of oil production with about 30 billion barrels of mature reserves, then to hold 12 million barrels a day production might require about 75 billion barrels of proven reserves. Saudi Arabia might start to decline in about ten years if they have about 110 billion barrels of oil reserves and pump 12 million barrels a day for ten years. This theory is only a guesstimate and made certain assumptions that might or might not occur. Note: There were smaller fields in Saudi Arabia not listed on the chart posted above.
It is not certain whether or not OPEC will use full capacity.
Oil is finite. Some large oil projects took ten years to develop. Deep offshore rigs are scarce and to drill one well cost $100,000,000. recently. Day rates were yet rising. The most expensive deep well I read about was in the GOM and cost about $200,000,000. to complete. This well was not successful. Some companies were finding wells that produced 150 barrels a day to be profitable. Once upon a time they got 10,000 barrel a day wells in the Middle East. Back then they would not attempt to drill 30,000 feet under the sea in search of oil pools, these days they have done so, and yet the world is wanting oil at high prices.
The only problem with what your saying is Ghawar makes up about 50% of KSA production. This blows out any assumptions based on the central limit theorem.
You cannot compare this to the US like your doing. Its probably more like 10GB backing 4mbd and 60 or so backing the rest of production. So longer term production probably fits into a 10mbd-6mbpd depending on the true status of Ghawar. Taking into account export land you need only focus on how long Ghawar will last to figure out KSA's future. Note this is pretty much the same situation as exists in Mexico. One mega field making a inordinate contribution. I think overall Mexico and KSA are more comparable then the US and KSA.
Now if Ghawar really does have say 30GB or more left then 12mbd seems reasonable. Also they have not really done as extensive of a drilling campaign as happened in the US. My take is that KSA either can produced up to 12mbd or more if they really wanted for decades and they are holding back if you will for political reasons.
Or Ghawar reserve estimates are high and its production may be declining already. This 60/10 split seems as capable of matching current production and any other. This basically assumes Ghawar is even more extensively developed than the US is on average. This is not a bad assumption and holds for Mexico for example.
Canterrel production is basically state of the art while other areas are far less developed.
This is why Mexico/Canterrel is a better match to KSA/Ghawar. In any case since its really a single field issue production can be kept quite high right till the bitter end so KSA should be modeled as a single field then all the rest IMHO.
Well, even KSA wouldn't include Khurais since the whole world knows that it is still being remade into something more beautiful (i.e. it isn't producing anything right now). Maybe you meant Khursaniyah, and they might have been loopy enough to include it (even though it is still a no-show) since there seems to be a disconnect between the actual reality in the ground and the virtual reality of the pinheads at the top of the corporate ladder.
Caught me napping. It is true Khursaniyah is scheduled to be completed in a few months. Khurais sometime in 2009 or later. I also erred in stating obsolete United States petroleum reserves. The United States had reserves of 21.757 billion barrels in 2007. Five million barrels a day were produced from about 21.757 million barrels of reserves.
Saudi Arabia can produce about nine million barrels a day from stated reserves of over 250 billion barrels and stated they needed make sure to set aside some oil fields for their children. Some were yet stating the world contains trillions of barrels of conventional reserves.
Mexican oil exports are declining. Indonesia is withdrawing from OPEC. Syrian oil exports were declining. Venezuelan production is declining. Ecuador needs help to offset production declines, and Brazil cannot get enough deep water rigs.
So using this number KSA could have as little as 40-60GB of reserves and still easily produce at its current levels. In general since KSA's fields where developed later with better technology production levels can probably be maintained agianst a lower resource base. In the US about 2mbd is produced from stripper or low production wells. If this is removed since it does not seem to be common in KSA then we are talking about 3 mbd from a reserve level of about 10-15 GB. This still gives the 40-60GB result. Hell you can give them 10GB of oil just because they are nice guys and you still come up with KSA being about 60% depleted.
So given the maturity of the fields the current production is entirely consistent with the lower estimates of KSA reserves of about 160GB and a remaining reserve level of say 40-70GB.
Now if they do have 100GB plus of reserves then they should be able to hit 20mbpd if the wanted to without breaking a sweat. Also if they have so much oil remaining twiddling with a few bucks in price and damaging their customers economies is stupid. 40-50 bucks a barrel or even 100 is plenty. The time to open the taps and make some money esp considering that the rest of the world is in decline is now. In fact its been reasonable for a long time. If the are worried about oil prices collapsing then they could easily have raised production by a few mbd every few months. On the financial side considering the amount of dollar reserves KSA has they have lost a lot of money as the dollar slides and will lose more. So unless they start dumping dollars as fast as they get them this high price regime and sliding dollar is not resulting in any real gain for KSA. Given that that they sell in dollars and generally buy in Euros I'd suspect they have not benefited much from the recent price increase. Next the dollar peg is causing serious internal inflation issues further devaluing the return the get for oil. If they just ditched the dollar I'd find their stance more credible.
You might be interested in PFC Energy's Global Liquids Supply (pdf). I referenced this study in my article Sleepwalking Toward the Oil Precipice.
Their reserves assessment for Saudi Arabia (and OPEC as a whole) is similar to those posted here.
-- Dave
thanks Dave.
since we all get similar answers, it just goes to show that it's really not that hard to come up with a decent ballpark estimate for OPEC reserves - despite all the wringing of hands and knashing of teeth by economic analysts. the geological reality is pretty clear to anybody who wants to open their eyes.
cheers
phil.
duplicate