| The Bullroarer - Friday 22 February 2008 | The Oil Drum: Australia/New Zealand | Tapping The Source: The Power Of The Oceans |
Australia and the Export Land Model
Posted by aeldric on February 22, 2008 - 11:00am in The Oil Drum: Australia/New Zealand
I normally try to be a “Good News” kind of guy, but today I bring bad tidings. Despite my previous claims that Australia is The Place To Be, we are in for some tough times here.
TOD has featured the Export Land Model (ELM) on several occasions (http://www.theoildrum.com/node/3018 ). A summary can also be found in Wikipedia.
The concept is deceptively simple:
Oil producing countries service internal markets first, and then export their surplus. Observations of oil exporting countries show that their internal markets continue to grow rapidly even after the peak. So their exports are hit by 2 factors - declining production and increasing domestic consumption. As a result, their export capacity drops with unexpected rapidity.
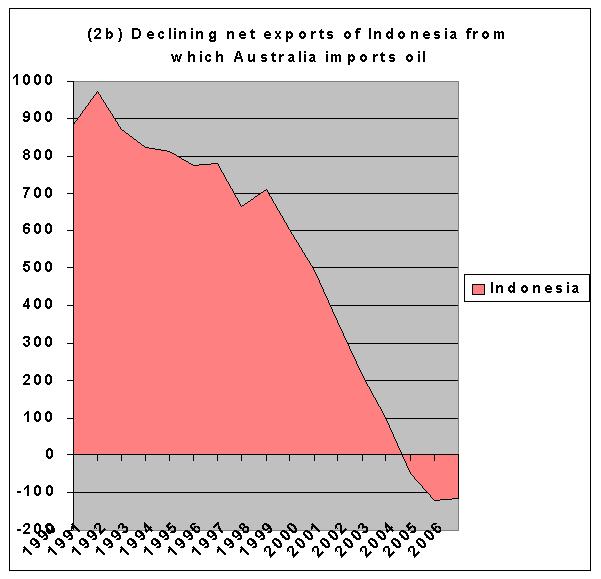
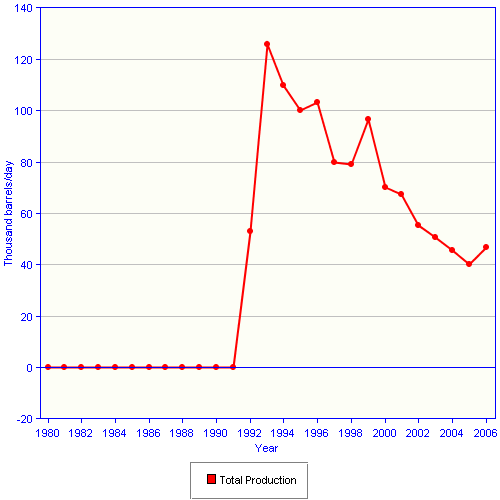
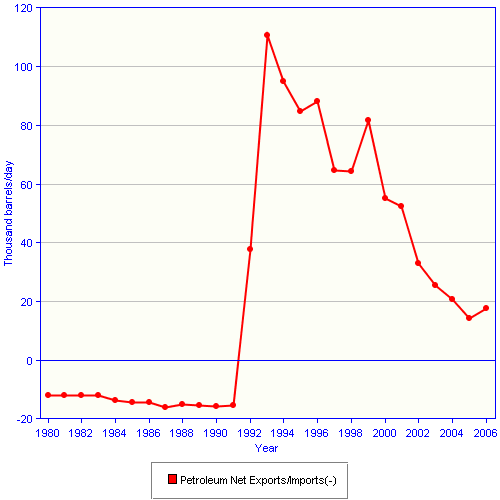
An Example: Precipitous Decline In Net Exports From Indonesia.
Source: Matt Mushalik, based on data from http://tonto.eia.doe.gov/country/index.cfm
The consequence is that the effects of Peak Oil hit importing countries disproportionately, and the effects occur very rapidly once the exporting trade partner(s) have peaked.
The “Big Player” importing nations have responded to an increasingly constrained energy future by attempting to “lock in” access to energy resources. They are employing a number of strategies:
- entering into long-term supply contracts (e.g. China’s long-term deals with Woodside for Australian LNG, and the China/Russia Long-Term oil deal http://gr.china-embassy.org/eng/xwdt/xw2003/xw200305/t145719.htm )
- buying a controlling interest in resource companies (e.g. China recently made an unsuccessful bid for UNOCAL in the US, but looks like having more success with its rumoured bid for Oil Search here in Australia)
- securing resources through treaties (e.g. the US’s NAFTA treaty with Canada, which commits Canada to supplying the US with oil )
- military adventure (dare I mention the US again here?).
The response of the oil exporters is more veiled, but it appears that countries like Russia are moving towards a Resource Nationalism policy, husbanding their energy resources and making less available for export.
Thus we have a three-fold problem:
1. Decreasing exports from producing countries due to declining production and increasing domestic consumption
2. Decreasing exports due to an evolving Resource Nationalism policy
3. Increased “lock-in” of available exports by the Big Player importers
The analysis of the export problems so far has largely focussed on the US and has concentrated on mitigating the problem by locking in supply (http://www.youtube.com/watch?v=9Ed9jsKAOHU ). The analysts and strategists appear to be focussing on the fact that the big players can lock in supply and thus partially mitigate this problem, but the question "Where does this leave the small players?" has largely slipped under the radar.
Here in Australia, it is time to ask that question. What will be the impact of decreasing oil exports on Australian markets?
There has been a flurry of recent warnings about a “supply crunch” starting in around 2010-2015. These warnings have come not just from advocate groups, but from the International Energy Agency (http://omrpublic.iea.org/mtomr.htm), and from several of the oil companies, with the most recent and most forceful warning coming from the Shell CEO (http://www.shell.com/home/content/aboutshell-en/our_strategy/shell_globa... ).
The consensus seems to be that there will be a serious supply crunch within 5 years, so we should look at how we will be positioned in 5 years.
Australia.
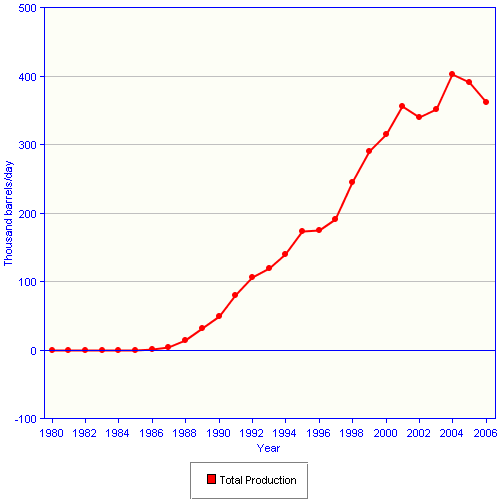
Australia currently produces a bit over 50% of the oil we consume. Our production peaked in 2000, and is now in decline, with occasional jumps as new production is added. We currently produce a bit over 500,000 bd and this figure is dropping:

Australian Oil Production (Click to Enlarge)
Source: EIA, http://www.eia.doe.gov
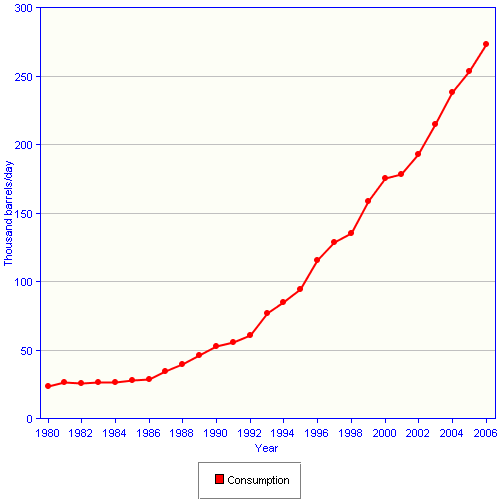
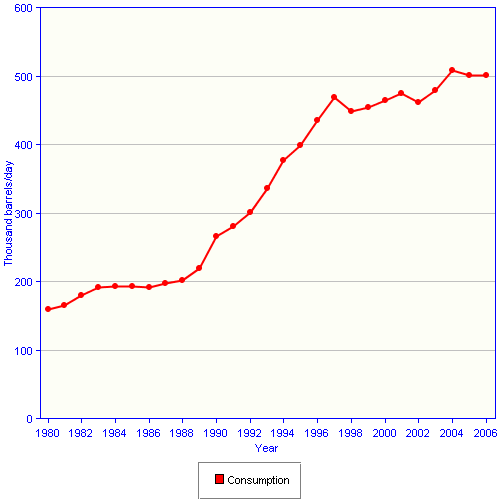
Our consumption has rapidly approached double our production. Consumption appears to have stabilised short of 1,000,000 barrels per day.
As we continue to grow in the years to come, our oil consumption is likely to continue to grow. However in that same period our oil fields will continue to deplete. Thus, inside of 5 years we will be able to supply significantly less than 50% of our demand. Based on the graphs above, it will probably be less than 40%.
What happens to Australia 5 from now years when we are competing for the very small amount of exported oil that is not already locked in? To answer that, we need to look at where our oil comes from.
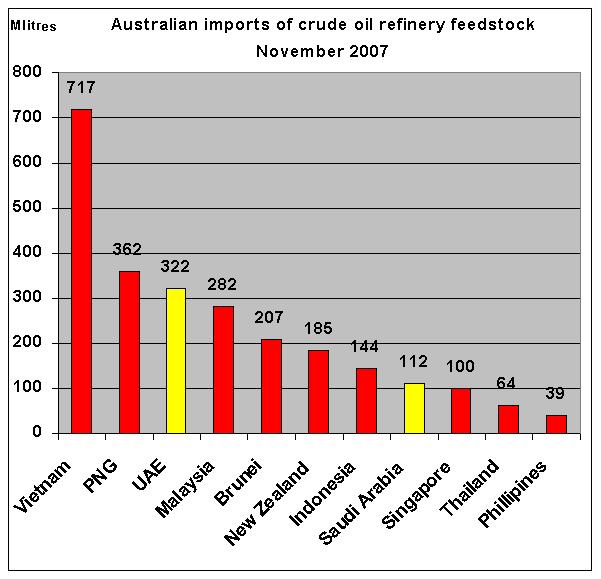
Countries Exporting Oil to Australia.
Source: Matt Mushalik, based on data from http://tonto.eia.doe.gov/country/index.cfm
We source our oil from a number of countries, with the most important being Vietnam, PNG, UAE, and Malaysia. Our dependence on these nations is steadily increasing. Although we are bringing more capacity online, this capacity has not kept pace with our decline rate, driving the increasing dependence.
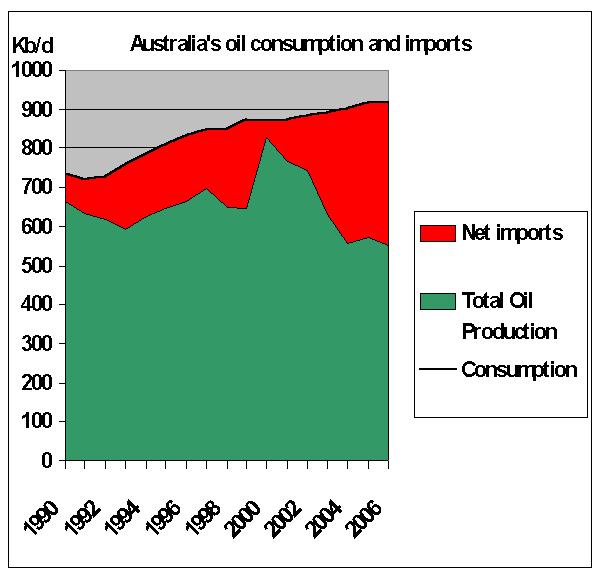
Australia’s increasing dependence on imported oil.
Source: Matt Mushalik, based on data from http://tonto.eia.doe.gov/country/index.cfm
However the countries that we source oil from are experiencing declining exports.
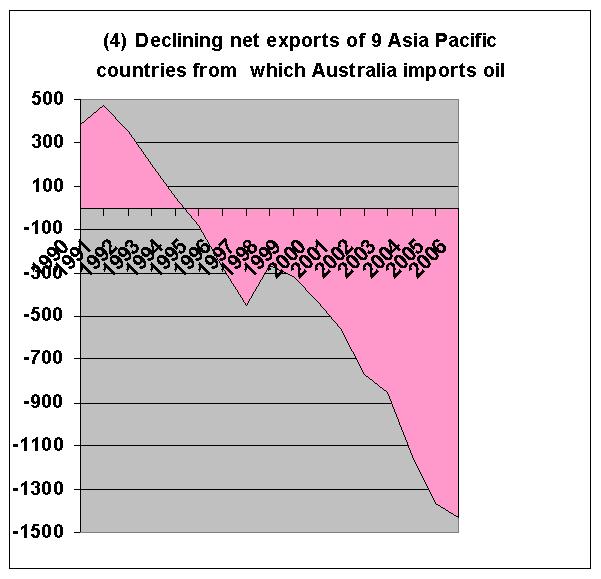
Declining Exports From Countries Exporting Oil to Australia.
Source: Matt Mushalik, based on data from http://tonto.eia.doe.gov/country/index.cfm
So our oil comes from countries that are suffering from an increasing inability to supply oil. We are not the only nation that these countries supply oil to. As their capacity to export oil declines, we are not likely to be a priority customer.
So which of our suppliers will be in a position to continue supply in 5 years?
A Look At Australia’s Top Four Suppliers.
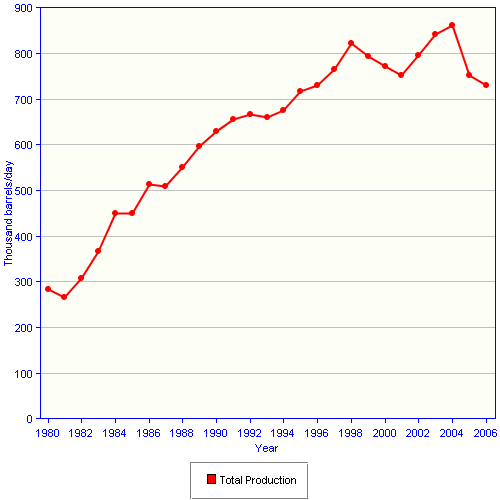
Vietnam, which is by far our biggest supplier, provides an interesting case history. Vietnam’s oil production peaked in 2004.
Vietnamese Oil Production.
Source: EIA data, http://tonto.eia.doe.gov/country/country_energy_data.cfm?fips=VM
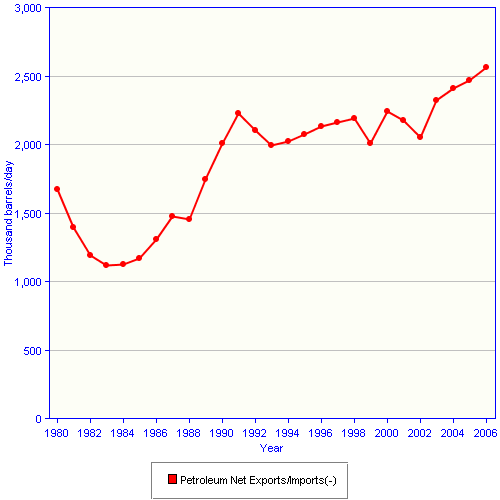
The decline in production since 2004 appears to be significant. When we look at exports, however, the decline is not just significant, it is precipitous.

Decline in Vietnamese exports.
Source: EIA data, http://tonto.eia.doe.gov/country/country_energy_data.cfm?fips=VM
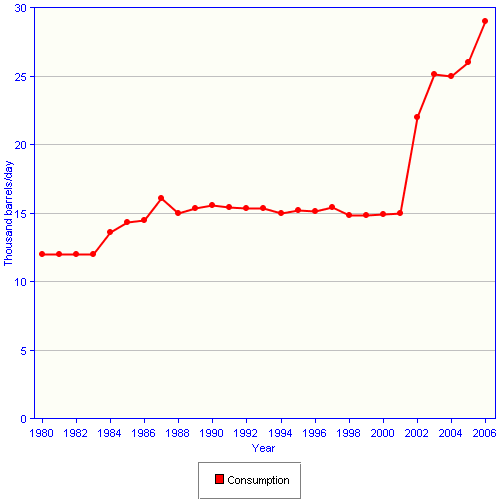
Vietnam’s production peak occurred in 2004, but their exports peaked earlier, in 2000. This is explained when we look at their ferocious increases in domestic consumption:
Vietnamese Domestic Consumption.
Source: EIA data, http://tonto.eia.doe.gov/country/country_energy_data.cfm?fips=VM
The charts above certainly suggest that it won’t take long for Vietnam to hit exports that are effectively nil, perhaps as little as 2 years. However the graph does not tell the full story - Vietnam has a number of projects coming on line over the next few years.
It is hard to estimate flow rates in the 5 year range based on projects that have not even been completed yet. Most recent oil projects have generally been dogged by delays, disputes and disappointments. These have been caused by the fact that modern projects are going after increasingly challenging fields, and the difficulties are exacerbated by shortages of both resources and qualified staff.
However, given the number and size of upcoming projects, it is probably reasonable to assume that while Vietnam may continue to see a drop in exports, it will not drop to zero in the near term. My prediction is that Vietnam will drop below 50 kbd within 5 years but the rate of decline will slow.
This prediction is based on nothing more than looking at the upcoming projects documented in http://en.wikipedia.org/wiki/Oil_Megaprojects, then weighing the projected peak flows (which are likely to take a few years to achieve) and the difficulty of the projects, against the recent historic evidence for delivery delays and cancellations. If there are industry insiders who can give me a better prediction for Vietnam’s export capacity in 5 years, I would love to hear it.
Based on this prediction, it is highly unlikely that Vietnam’s exports to Australia will keep pace with Australia’s rising demand.
Our next largest supplier is Papua New Guinea. As with Vietnam, PNG’s oil production chart also suggests that production has peaked and is now in decline:
Papua New Guinea Oil Production.
Source: EIA data, http://tonto.eia.doe.gov/country/country_energy_data.cfm?fips=PP
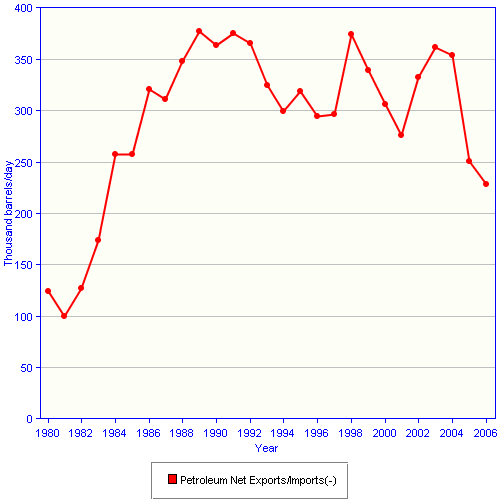
Not surprisingly, PNG’s net exports also show a significant drop:
Papua New Guinea Oil Exports.
Source: EIA data, http://tonto.eia.doe.gov/country/country_energy_data.cfm?fips=PP
On the basis of this graph, it appears that PNG, is rapidly approaching nil exports. PNG’s domestic consumption patterns do not suggest much hope of a recovery for exports:
Papua New Guinea Domestic Consumption.
Source: EIA data, http://tonto.eia.doe.gov/country/country_energy_data.cfm?fips=PP
With consumption increasing at this rate, an improvement in PNG’s declining exports is unlikely. There is nothing at the Megaprojects site (http://en.wikipedia.org/wiki/Oil_Megaprojects ) to suggest that a major turnaround is likely. On the surface, it appears that PNG will only be a significant net exporter for a few more years. Once again, I would love to hear from anyone who can enlarge on, or contradict this view.
Australia’s third largest supplier is the UAE. Here at last we have some good news, with no sign of a net export decline:
UAE Oil Exports.
Source: EIA data, http://tonto.eia.doe.gov/country/country_energy_data.cfm?fips=TC
So the UAE is showing modest increases in exports. It is probably reasonable to hope that the 12% of Australian imports supplied by the UAE may still be supplied in 5 years.
Australia’s fourth largest source of oil is Malaysia. Malaysia’s graph shows signs of a plateau and decline, with the production decline commencing in 2005. Colin Campbell (in material released by the ASPO and quoted at http://www.theoildrum.com/story/2006/10/5/215316/408) estimates that Malaysia will decline at 6%.
Malaysia Oil Production.
Source: EIA data, http://tonto.eia.doe.gov/country/country_energy_data.cfm?fips=MY
Malaysia’s exports show the expected decline:
Malaysia Oil Export Pattern Matches The Pattern of Plateau and Decline.
Source: EIA data, http://tonto.eia.doe.gov/country/country_energy_data.cfm?fips=MY
Malaysia’s graph suggests a drop to nil exports within around 5+ years, however this may be attenuated by Malaysia’s domestic consumption, which shows signs of stabilising:
Malaysia Domestic Oil Consumption
Source: EIA data, http://tonto.eia.doe.gov/country/country_energy_data.cfm?fips=MY
The megaprojects site (http://en.wikipedia.org/wiki/Oil_Megaprojects ) suggests that more production might be coming online in the next few years. Malaysia may be able to prolong the decline in exports for some time if they can hold production decline to 6% or less and limit their growth in consumption.
Summary.
So of Australia’s top 4 suppliers, 3 show declines in exports. I will not bore the reader with further charts; I will simply comment that as you work through the list, you do not find that it gets any better.
More worrying is the fact that Australia is not the only country competing for this diminishing supply. The exporting countries do not just export to us, they export to many countries. As their exports diminish over the next few years, they will be forced to choose. Will they choose to export to the economic and military powerhouse countries, or will they decide to “be nice” and ship their oil to Australia? I would not expect to find many analysts who would bet on “nice”.
Questions:
Q. Do producers really drop to zero net exports? Surely as they approach zero they find ways to keep exporting?
A. Britain dropped to zero net exports, Australia dropped to zero net exports, Indonesia, US, etc, etc. It is possible that once the price of oil goes high enough a trickle of oil will continue to flow, but the price will need to go very high and the trickle is likely to be very small.
Q. What will happen to small developed nations that do not produce any oil?
A. They will compete with us to buy the small amount of remaining oil. They will probably be willing to go very high indeed to secure the oil they need.
Q. Are we doomed?
A. No. But we are in for a tough time.
Conclusion.
It is likely that Australia faces some tough choices. This crisis has slipped “under the radar” because the ELM is a relatively new model and we are only now coming to grips with the consequences.
In 5 years our oil demand is likely to increase by a modest amount – perhaps as little as 5-10% - but the ability of our suppliers to export to us is likely to be substantially diminished. The degree to which the exports will be diminished will depend on the success and flow rates of new projects. My estimate, based on current trends and future projects planned by our suppliers, is that a cut in exports by 35-45% is not beyond the realms of reason.
So we are likely to have less oil, and we are going to pay much more for it. We can expect locally produced oil to meet 30-40% of our needs in 5 years. If we accept that we are limited to our “share” of the diminished exports then we can expect to face a shortfall of around 20-30%.
If it is closer to 20%, then we face an extremely difficult time. However, if it is 30% we face an economic catastrophe. Which is it?
Unfortunately, the “error bars” on this estimate are significant, and even 20-30% is more precise than I can justify. For the shortfall to drop below 20%, the upcoming projects would have to be delivered on time, would have to reach their estimated peak capacity, and would have to achieve this capacity quickly. Given the recent history of such projects, this is not the way to bet. A bet that the shortfall could go higher than 30% of imports, while unlikely, is not completely ridiculous.
Australia uses oil for the transport of:
- Food
- Goods
- People
- Resources
A significant reduction in the oil-based transport of people in Australia could probably be carried out if we are willing to accept the impact on our economy associated with the loss in tourist dollars (a move to expand electrified public transport would mitigate this impact, but not in the timeframe that I am looking at). However our capacity to transport food, resources and goods is critical to our personal and economic well-being. The immediate impacts of a 30% reduction in oil supply are not pleasant to contemplate. The longer term and knock-on effects can scarcely be imagined, but are likely to be wide-ranging.
We could not accept that scenario. However our alternative is to pay potentially prohibitive prices for the small amount of oil that has not been locked in. Unfortunately, every other nation in our situation is likely to reach the same conclusion, so competition is likely to be fierce.
Where will this oil come from? Mitigating against the concerns outlined above is the fact that some countries still have an increasing production capacity. As this oil comes on line there is likely to be fierce competition for it, but Australia's economy is relatively strong - we should be better placed than many other nations to bid for some of this oil.
There seems little doubt that we will be forced to pay a very high price in order to “bridge the gap” while we commence building a sustainable energy infrastructure. However, we are lucky enough to be well placed to pay the price and bridge that gap.
The thing that I find surprising (and even a little frightening) about this scenario is that it is not in the distant future. It is only necessary to project out 5 years to see a significant probability of shortfalls.
In my next article I would like to explore the options open to us as a nation.
Acknowledgements
Obviously the whole article is based on the Export Land Model. This model was based on work by Jeffrey Brown, who credits a number of other contributors.
I would like to thank Matt Mushalik, many of whose graphics were used in this article. I use his graphics with permission.
As always, Big Gav and Phil Hart have been generous with assistance and feedback.
Contact
- anz at theoildrum dot com
License

This work is licensed under a Creative Commons Attribution-Share Alike 3.0 United States License.
Archives
- November 2010 (2)
- October 2010 (5)
- September 2010 (4)
- August 2010 (8)
- July 2010 (2)
- June 2010 (2)
- May 2010 (6)
- April 2010 (7)
- March 2010 (12)
- February 2010 (11)
- January 2010 (7)
- December 2009 (10)
- November 2009 (6)
- October 2009 (7)
- September 2009 (10)
- August 2009 (10)
- July 2009 (3)
- June 2009 (14)
- May 2009 (10)
- April 2009 (15)
- March 2009 (16)
- February 2009 (16)
- January 2009 (15)
- December 2008 (15)
- November 2008 (23)
- October 2008 (25)
- September 2008 (24)
- August 2008 (30)
- July 2008 (44)
- June 2008 (38)
- May 2008 (48)
- April 2008 (43)
- March 2008 (29)
- February 2008 (32)
- January 2008 (30)
- December 2007 (26)
- November 2007 (32)
- October 2007 (11)
This will likely be dealt with in the next article, but anyone have a handle on the size of Australia's LBG supplies, depletion rates and how much is locked in to long-term contracts?
IOW, how much will Australia be able to substitute it for petrol?
If you mean LNG, then I'll be posting something on Australian Gas real soon now (which might still be a couple of weeks away, at my current slow rate of progress).
LNG it is! I'll look forward to that, Gav
Dominoes and International Commerce. Otherwise known as "Connecting the Dots".
Do shortages in Australia affect the rest of the world, and how fast does it fall apart? You bet it does buckos! So the ELM kicks in and causes Auzzie Land to undergo large industrial cutbacks, so what? Well, there is a large and significant Aluminum production facility in Canada (initials RT) that depends on the Alumina coming from Gove, Au for the feedstock. N. American energy use is accelerating towards electricity use to displace fossil fuel use. Greater electricity use means more aluminum conductors for transmission and distribution circuits, and the dots start to connect. Trouble in Auzzie Land means big trouble in Gross Consumption Land (GCL) and the dots get connected while the dominoes continue to drop.
S. Africa remains as a microcosm of what/will happen on a global scale in the world of interdependent industries and processes. We are not independent nor isolated. Bad weather in the southern hemisphere means tomato prices rise this week, Brazil joins OPEC because it desires protection from American hegemony, the Athabasca River has no more water to offer so the Alberta Tar Sands will not offset Saudi oil supply, and hush, hush, hush and we all fall down.
Natural gas prices in western N. America will soon compete with world prices because LNG is happening. Really! Shipping natural gas around the globe has to be the clearest sign of mass insanity. Both shipping inefficiency and application inefficiency dictates we are either i) no smarter than yeast, or ii) not socially evolved past the Chimpanzees.
In closing, I hope posting this on the Aussie site will prevent the black suburbans filled with men wearing dark glasses from showing up at my door. No, really, its coming to this... the battle for gas and oil has gone domestic.
/vsyxx
We are likely to give everything a go. In a report on ABC TV last week, Linc Energy are trying to produce liquids fom coal seam methane. The alrming thing is that they were going to ignite the coal in situ, pump in air to keep the fire going which in turn provides a heat source to drive coal gas and steam out through a well. The resulting liquid was touted as clear "diesel" which could be further refined.
If this works, one has to wonder how long our export coal industry will last.
This declining net export theme was first written about by John Hallock in a 2002 paper (with Hall and Cleveland) reviewed here on Energy Bulletin.
Heres a link to the full paper, "Forecasting the availability and diversity of global conventional oil supply" (pdf warning 1.4mb)
Matt Simmons, who inspired my work, started talking about rapidly rising consumption in exporting countries in the same time frame.
Very good work. I continue to be amazed that net oil export capacity is not the #1 story worldwide.
Regarding the end game for net oil exporters, I have slightly modified our terminology, from saying that they will hit zero net exports, to saying that they will "approach" zero net exports; however, the real damage to the world economy comes not from the final 10% decline in net exports, but from the initial 90% decline.
The ELM is a simple mathematical model that shows net exports going to zero in 9 years, from the final peak, with consumption equal to 50% of production at peak. Note that only about 10% of post-peak production from Export Land would be exported.
The thing that continues to amaze me is how similar the UK and Indonesia net export declines were, given vastly different per capita incomes and energy taxes/subsidies, with the UK going to zero in 7 years, Indonesia in 8 years. The common factor was that consumption was about 50% of production at the final peak.
It seems to me that virtually every net oil exporting country in the world would fall somewhere between Indonesia and the UK in terms of per capita income and energy taxes/subsidies.
Regarding the UAE, it was the only top five net exporter to show an increase in net exports in 2006 (EIA, Total Liquids), but our (Khebab/Brown) logistic based middle and low cases are not very optimistic, and the high case is only slightly less pessimistic (the projected middle case 10 year net export decline rate is -4%/year):
http://graphoilogy.blogspot.com/2008/01/quantitative-assessment-of-futur...
Aeldric, you have discovered that ELM is already 'alive and well' - as you have found, it's already in the data, you just have to search it out, no longer just a theory.
I would just add that you have a chart there called 'Australia's Oil Consumption and Imports', this shows the 'import land' problem very well.
Once an importing country that has some production of it's own peaks, it's increased demand % for imports suddenly becomes = (total consumption growth + the decline rate of local production) and sadly this is often a massive increased demand, as in the case of Australia.
However, spare a thought post 'world peak of net exports' for those countries where ~100% of consumption is imported - that is every country in the Europen Union except two!!!.
At the moment 'world net exports' are down ~3% from a peak in late 2005, this has allowed the 40 or so 'net exporting' countries to continue to grow their consumption while world all liquids production has been flat!
Looking on the bright side, at least you will easily meet the UN required 30% reduction in CO2 emissions by 2020 from oil!
Maybe now you can see why there has been so much emphasis on climate change emissions - working towards a planned defined goal (IMO too late and unreachable) rather than a catastrophic economic brick wall.
Hi WestTexas,
How did you calculate the growth and decline rates? For instance, the Saudi rate you quote is not the 2005 to 2006 rate. Is it the average growth (or decline) over some number of years going back? Thanks.
We used the predicted range of consumption and production numbers for 2015 to give us the low case, middle case and high case projected net export decline rate from 2005 to 2015.
Once production in a given exporting country starts falling, the actual net export decline rate tends to accelerate with time, which is what we are almost certainly going to see for Saudi Arabia in 2007 versus 2006.
Sorry, I meant how did you get the +4.4% consumption number for Saudi Arabia? Is that the average of the last 2 years demand? Or three years? Or some other procedure? I don't doubt the results, I would just like to be able to explain how it was calculated if someone was to say, why shouldn't it be 2.2%.
Khebab used a Monte Carlo simulation method, based on recent consumption, to estimate a range of future consumption, which resulted in very low projections for Russia.
I thought the ELM was accepted here?
Isn't this a big load of duh?
Actually, Stuart, at least in the past, has generally dismissed the concept.
And in a larger sense, until fairly recently, even in Peak Oil circles, almost no one (with the exception of some people noted above) was paying any attention to net oil exports.
As Dr. Bartlett noted, we have trouble with the exponential function. This is perhaps doubly true with the net export phenomenon--where the combination of an exponential decline in production and a generally exponential increase in consumption results in vicious net export decline rates. While whether Saudi Arabia has peaked continues to be a hot topic of discussion, the amount of oil that they actually delivered to the market in 2007 probably declined at around 10%, versus about a 5% drop in 2006.
We need confirmation for the theories that everybody accepts too, not only for the controversial ones.
Otherwise, we wouldn't know if we were really right, and could miss some important insights.
Isn't this a big load of duh?
Depends on your understanding of "duh"...
I thought the piece on 4 billion cars was intended as humor.
"Duh", I said when I read it, "A big load..."
If we agree on validity of the Export Land Model, shouldn’t we be working to understand effects of the Import Land Model?
Import Land Model- A model of the effects of the decline in oil available for consumption to discretionary sectors of an importing nation’s economy as a result of the Export Land Model and simultaneous domestic consumption increases by non-discretionary sectors of the economy. This combination of declining imports and increasing domestic consumption by a significant fraction of the domestic economy leads oil available for all other sectors of the economy to decline at a far faster percentage rate than oil availability itself is falling to the importing nation.
Assume that an oil importing country – Import Land – produces 10 mbpd, consumes 20 mbpd and imports 10 mbpd. In Import Land, 25% of all oil is consumed by the government (18%), energy production (6%), and agricultural (1%) sectors of the economy, or 5 mbpd total (WAG, Reference needed).
Over a five year period, imports drop by 50% to 5 mbpd due to the effects of the Export Land Model. Meanwhile internal production drops by 20% to 8 mbpd. This leaves Import Land with 13 mbpd to consume, a drop of 33% over 5 years (9%yoy).
The government of Import Land will be under severe societal stress to keep energy, food, and governmental services working. If they somehow maintain these sectors without increasing internal consumption, it will still leave only 8 mbpd for the discretionary economy, a decline from 15 mpbd over 5 years (13%yoy).
This example conservatively assumes no growth and low estimates in non-discretionary spending, low Export Land and Import Land oil production decline rates, and starts with a nation that only imports half of its oil. All are likely (or certainly) optimistic for many Import Lands.
Clearly the economic impact on the discretionary economy will be far more severe than is suggested by the Export Land Model.
I called it "Rationland" a while back.
Basically you can rank usages in decreasing order of priority, each of which ratchets up the compound decline rate for what's left. Each carves out what it thinks it needs and leave what's left for those further down the pile.
Net effect is that in a well-ordered economy certain sectors hurt VERY fast. Third world first, suburban poor second, discretionary third, and so on. The resilience of that economy to change and loss eventually defines how fast it collapses. As it collapses it drags down other usage, giving others further down the path the time to adapt - it they chose to take it.
Our future gets defined by how soon people realise what's happening.
First stage is already happening, second is not far off.
Our world is a fragile egg, balanced on a knife edge that keeps on tilting. The route down is not as secure or pleasant as the route up.
Yep thats about right.
Also export land itself is a multistep process that mimics ration land.
First the oil exporters ensure the local market is well supplied. Next that are the first tier importers for finished products if they don't have enough refining capacity. Next on the list are countries with refining capacity in excess of internal demand. Next are countries that import both crude and finished products. Next in the chain are countries that import only finished products. And last are poor countries that subsist on imports of diesel and gasoline and worse depend on diesel electric generators. And at the very end are poor countries that are wholly dependent on imports and have subsidies.
We focus a lot on crude oil itself but the real impacts right now are going to be in finished product flows given the above chain. Its like North Dakota in the US the guy at the end of the pipeline gets screwed first.
I think that finished product exports will experience tightening first simply because more local markets have to have demand met before exports are sent on.
So if I'm right we will see a spike in gasoline prices this summer widening above oil prices as we have to pay more for gasoline imports. So the poor who drive long distances in low MPG cars could get hit hard as early as this summer.
Memmel, crack spread can only increase with high utilization rates, otherwise partially idle refineries will bid up crude prices. We’re seeing it today with the high prices and tight spread. Tight supply means tight spread.
This time its not from the crack spread but lack of imported gasoline.
It looks like the crack spread is increasing but the gasoline importers have to cover increased costs for gasoline and oil we be expensive. Or refinery utilization might actually be down while the "crack spread" is high.
Lest say you can produce gasoline from imported crude at 2.50 a gallon but your imported gasoline or blending components is coming to 3.50 a gallon. You have a dollar spread between imports and gasoline you make but if you don't import you don't have enough gasoline. Logically you have to either back down on internal production or probably back off on imports until the price increase to cover your import costs. Your correct that calling it crack spread is not quite right but its easier then saying imports are substantially more expensive than domestic production. We actually saw refinery utilization back down a bit last year while imports where robust. I'm not saying that you will get a dollar spread but imported gasoline will get expensive so no matter how you cut it your going to have to get prices up to cover your total costs.
Also it makes sense that if imported gasoline is expensive crude is also expensive from the base export land model.
The actual crack spread for locally produced gasoline might be quite low under these conditions and we actually saw that last year except last year I don't think imported gasoline and blending components where a issue I think they where actually cheaper then running our new heavy/sour refineries at capacity.
At a million barrels a day of gasoline imports its enough to influence the overall price.
What I'm saying is we simply won't have enough imported gasoline to meet demand without a significant increase in price even with our refineries running at maximum and a low crack spread. This means something has to break.
Crack spreads have to start bouncing back to bring in more imported gasoline.
But notice its a bit of a catch 22 if we ramp up refinery utilization then elsewhere probably in a nation we import gasoline from they won't have enough oil to support export to us.
The intrinsic problem is we have to import significant amounts of gasoline and blending components. Once the worlds oil supply is low enough then we will see shortages and expensive gasoline imports. This will result in strange moves in the crack spread. Some places will back down on exports as its not cost effective thus idling plants and resulting in a low local crack spread. Until gasoline supplies get dire then we will import like mad and crack spreads may widen but the cost of oil will go up as well so :)
The key component is that imported gasoline and blending components will become expensive and scarce this cost will have to be passed on to the consumer. Its not clear if the real crack spread will widen or not.
What will happen is gasoline prices vs oil prices will start to widen as long as we need imported gasoline.
Garyp, Could you embellish your theory a bit? Are you suggesting a bidding war, a governmental rationing system, or something else?
Simple really. The reaction of most governments to declining fuel supply will be to implement a form of rationing system. The UK has it all defined and written down, and I'll bet most others do too. Even the US is likely to implement something along these lines.
That rationing can be on simple availability, but might extend to price controls on the first items as well. Farmers already get red diesel with lower tax, but in future they might discounts on costs with the difference being made up from higher charges on group 4. All to ensure things are kept in check.
Now, if you total up the first three and cast the net wide enough to try to keep all key parts of civilisation working, together with the secondary feeders to those, you can end up with a sizeable percentage of the supply earmarked by the government to these purposes. From the point of view of the general motorist, trying to commute to work, the available supply falls even faster than exportland suggests, together with costs rising faster as well. If physical decline rate is 4.5%, exportland might make that 10% and rationland 18%. Each acts a multiplier.
Now rationing sounds like a sensible reaction to declining supplies. However the multiplier it puts into the decline rate of the fuel available to individuals means their opportunity to adapt is reduced. If, say, exportland forecasts max>zero transition in 10 years, rationland might cut it to 6 years. Its not just a matter of SUV > economical small car, its any vehicle to no vehicle, no commuting, within a few years.
Somewhere in the continuum of decline rates, there is a break point. Literally patience breaks, people react, society breaks down. Personally I think that's fairly early on (I agree with the MI5 maxim) but wherever it is, rationing can actually mean we hit it faster and with more certainty.
That's not to say that the alternative of farmers not being able to afford fuel is attractive either, just pointing out that rationing is no magic bullet and can actually make things worse.
And combine that with the multitiered ELM where some countries have to import gas too and then we ahve some very quick declines for certain parts of populations in certain countries. Essebntially you could make a complicated computer simulation isolating hwo falls first out of supply chain globally depending on supposed rationing scheme and structure of oil and refingin idustry /production in that particular country.
Call it mulititered ELM/Rationland collapse computer simulation.
Call it Multiiterated ELM/Rationland Decline Evaluator
(for the french)
;-)
Exactly and thanks for fleshing this out. I've been banging on WT for a while now that the ELM is a mutli-tiered effect. The key is it gives you good indicators to look for.
1.) Poor countries that import 100% diesel gasoline go first. Already happening.
2.) Price of gasoline/diesel for export rises dramatically vs crude.
What is the global market if any for this ?
3.) Crude prices rise as countries with excess refining capacity import more to make diesel/gasoline for export.
4.) Refining costs for "local" usage increases. For countries that are dual refiners/importers they have to deal with the cost differential between locally produced gasoline from crude and imported gasoline.
5.) Real spare refining capacity exists in the global system.
5.) Crack spreads become volatile but overall for countries that import finished products the cost of gasoline/diesel vs oil is increasing even as the price of crude is increasing.
6.) Hoarding probably becomes commonplace and OPEC uses high stock levels where measured to justify lowering production.
7.) Supply contracts start breaking down and suppliers renegotiate because of higher prices sending more people to the spot markets for crude and finished products causing firm lower price bounds below speculative increases.
The important thing is trust is replaced with fear leading to more imbalances in the market.
7.) Systematic shortages start developing around the globe. A movable famine instead of a movable feast. This is a result of attempts to hedge in a volatile market failing. A lot more people will attempt to actually take delivery of real oil in the markets but the oil simply won't be available.
At any point in time at least one part of the world will be facing shortages.
In general the poorest will suffer more often than not but with the system glitching shortages are possible anywhere.
Volatility is rampant. And whats important is crude storage is probably not a good indicator of the overall condition of the market. For the US for example you should look at the crude storage level of the US and all the nations it imports gasoline from. For finished products its the combination of locally produced products plus import levels.
By the time crude inventory becomes a issue in the wealthiest nations the system will probably be close to break down so its a lagging indicator.
The EIA has spot prices for gasoline in several markets, including Rotterdam (NL) and Singapore.
Monthly price in Rotterdam in January was $2.23/gal; times 42 gallons/barrel, that's $93.66/bbl, or just $1.50/bbl over the
January price of Brent. The price in Singapore was $2.39/gal, or $100.38/bbl, or about $2.50/bbl above the price of Tapis.
So it's pretty clear that the world price of gasoline hasn't risen dramatically vs. crude. I don't know why you'd expect it to rise at the same time as the world had spare refining capacity, though; that does seem contradictory.
Read my ramblings I don't think this has happened yet but a multi-tiered ELM with each market ensuring adequate local supply before exporting implies that the first place divergence will happen will be in exported finished products.
At this point spare refining capacity is irrelevant to some extent since its crude supply problem. Your not getting enough crude to satisfy both your local market and export markets. In effect this is what ELM is saying at each stage your take care of the politically sensitive markets first before moving on to the free market. The key to ELM in my opinion is that local markets are not open.
The example is if crude supply is tight France or Korea will make sure that the home market is well supplied before they ship exports to the US. This will force the US into paying a premium for its finished gasoline and blending components.
I suspect that if this starts to happen the president will waive clean air rules which will offer a temporary reprieve by opening up the US market to more refineries.
So that would probably be a signal to watch.
Question for you is that spot prices in Rotterdam for the US markets ?
Or do you look at New York Harbor and LA ?
I think you have to read off the prices for NY and LA and if I'm right its a
13 cent spread vs Rotterdam. And look at LA.
However the historic data seems to show about the same spread back in time with a quick eyeball.
Thanks for the link I'll check from time to time. But I think we will see two leading indicators first we stop filling the SPR then we relax the clean air rules before we really need to take a hard look at the gasoline import situation.
Aeldric posted this on TOD:ANZ and it was Australia specific. Most of the discussion on TOD relates to how PO will affect the US or Europe or Chindia and very little thought ever given to how it will affect smaller countries or regions.
I thought it was a great post and and in no way deserved your "Duh?" comment. As an Australian it certainly shook my tree.
It is a very telling illustration for a particularly large island, apologies to Poms, which makes it easier to do. It might 'wake' people up, or allow those so inclined or capable to make predictions and take action.
Global renewable Energy, for Australia:
link
I think this post brings to light the interplay of several oil availability factors in an important way. Sure, ELM is a 'duh' to anyone who looks at it even cursorily. But the layers of effects as discussed herein by Xeroid, garyp, memmel and others helped take my understanding of ELM's consequences to a deeper level. So thanks to all. Here's my contribution. Essentially, the dynamic of increasing consumption and declining extraction works on both ends. That is, it works to decrease net exports from Export Land more rapidly than would gross declines in extraction or increases in internal consumption on their own, and it works to increase Import Land's net desired imports more rapidly than would either dynamic on its own. Some countries were doubtless never net exporters, but we're all well familiar with the fact that the US was once the supplier to the world. The US, in effect, is simply deep into the effects of its own experience with declining net exports. So the end result is that as the gaping jaws of net desired imports (NDI) open wider, the jaws of export land are snapping shut. Imagine yourself a baby bird, but the wider you open your mouth to be fed by your parent, the tighter they close theirs and refuse your need. The knock-on effects as discussed herein will overlap and multiply each other as will the effects of climate change, species extinction, population growth and a host of others work to exacerbate each other as deftly illustrated by the documentary What a Way to Go: Life at the End of Empire.
Having recently visited Hanoi on vacation, I find it hard to believe that Vietnam will be exporting large amounts of oil for much longer. Signs of growth in the economy are everywhere. The population is young, hard-working, resourceful and energetic. The country's first oil refinery is due to open soon, and others are planned. Per capita oil use is very low by Western standards (think of whole families riding on one motor bike!) but will surely increase.
Wonderful Article! I've understood the Export Land Model since I started reading TOD, but this article really brought home to me the bidding war that is sure to take place. I had no trouble at all substituting my poor little broke, redneck, Mississippi A$$ with a Kangaroo-Herder in Australia.
Another factor is imports of finished products such as gasoline and diesel. I don't know how much Australia imports but for the US its significant. These imports suffer a double export land model. First the oil has to be exported from a producing country which meets its internal demand. Then the country with excess refining capacity has to meet its internal demand before finally exporting finished products. This is the same situation as with oil exporters its untenable that they would export gasoline or diesel if they are facing shortages at home.
Its looks like the US imports some gasoline from Australia.
http://tonto.eia.doe.gov/dnav/pet/pet_move_impcp_a1_NAS_epm0f_im0_mbbl_m...
Australia's gasoline imports are not that small.
http://omrpublic.iea.org/trade/Ct_gs_2y.pdf
In my opinion the whole market in exports of finished products will be the first to experience problems as crude supply tightens. So you should look carefully at this. As the gasoline import market dries up large importing countries like the US will distort both the finished product markets and the crude markets. This will happen well before actual crude imports drop below internal demand in crude importing countries.
If I'm right I expect this summer for the US to have problems importing finished gasoline and for this to cause a significant price run up in both crude and finished gasoline for export. Expect us to waive our standards at first but its a situation that cannot be resolved.
About time someone hit the nail on the head regarding the US. This country has a daily oil deficit of 15 million barrels. Once exporting countries cut back to keep their remaining reserves for their economy, what's left of US manufacturing will drop like a stone. Along with that precipitous drop will be our entire economy. No country is so gravely poised to suffer the consequences of reduced exportation of crude as we are.
My wife wants us to add a guest house to the property, but I've nixed that until there is some news that clearly contradicts my concerns of peak oil. Right now we are doing the Cornicopian vs. Peakoiler dance. She keeps saying, "They will come up with something. Technology is amazing". But I'm not buying it. I just don't see an economically viable way to replace that much oil that fast.
Ditto here Cs,
I keep asking my wife, "Who are "they" ?"
She looks at me with eyes glazed over.
It's a question that doesn't compute.
It's like we reached the outer bounds of the Universe. The "Outer Limits".
They are they.
That's it. One does not go boldy forward beyond that event horizon in the fairy tale.
Who are those guys?
Butch Cassidy and the Sundance Kid
who are they?
they are people who want to solve global warming and/or make a lot of money.
here "they" are.
http://www.treehugger.com/files/2008/02/dieselhybrid_pi.php
http://www.treehugger.com/files/2008/02/sporty_loremo_d.php
http://www.treehugger.com/files/2008/02/tesla_motors_ra.php
http://www.nytimes.com/2008/02/17/business/17ping.html?_r=3&scp=2&sq=sol...
In 5 years? - I hope so.
I think a guest house could be a good idea if you are significantly better prepared for upheaval than your extended family and friends. You never know who might turn up at your doorstep, needing a place to stay. Do make it a post-peak practical guest house though, with super-insulation, passive solar design, and composting toilet (if wife and water board can be convinced:)
Three points:
1) Australia is a large net exporter of raw materials. Therefore although they don't have the forces to play the US military card to try to secure oil - they can play the resource card to ensure that they don't get frozen out. As such they are better off than many.
2) I would be surprised if there were not an offshore field or two in the region that Australia will claim by 2012. Its going to be a substantial area. Develop that and they can meet their limited domestic demands.
3) The layout of Australia, with the very concentrated populations, mitigates towards multiple approaches to reducing the demand and the car culture.
Another interesting angle to consider is Australia's peacekeeping role in East Timor. Indonesia is likely to be Australia's biggest local competitor for energy resources and East Timor has some. Not that I would imply that the Howard government would either: a). engage in real politic or b). recognise the impending energy vise in which Australians will soon find themselves.
Bryant,
We kicked John Howard ou of office last year. The new govt is led by Kevin Rudd who campaigned on being as much like Howard as possible with the exception of being seen as action oriented on climate change.
The new Energy Minister is intent on CTL and GTL. It will be interesting to see how that plays out given they have committed to a 60% reduction of GHG by 2050. Somehow I think that the economics will win over environment.
Its not the Howard government any more - and strange events have occurred in Timor since the changing of the guard as well.
Its worth noting that nations have struggled over resources since nations began. Timor isn't unusual, nor does it demonstrate a government belief in peak oil.
Also, Indonesia isn't the only other player - China probably is too, as is Portugal (to a much lesser extent). The East Timorese themselves occasionally try and assert some independence too (though the Mari Alkatiri example shows that this is a pretty hard road to take).
Yea...I knew you all sent Howard packing. And a good job of that too. However, the whole E. Timor peacekeeping business happened under his watch. I agree that East Timor is not unusual, and it does not necessarily demonstrate a government belief in Peak Oil...of course it does not exclude a government belief in Peak Oil either.
Frankly, as ELM accelerates, I think Australia will need to worry about her nearby neighbors...what is Oz's population say compared to Indonesia?
About 20 million to about 200 million.
A reminder. Just because there are ~200 million people in Indo means almost nothing. The Indonesians have enough trouble keeping the country together as is.
EG Aceh is an oil and gas rich province, that wants independence from "Java", just as there is an independence movement in resource rich East Papua. I suspect any hypothetical attempt to claim any part of the Oz mainland and adjoining gas resources would be a disaster for the "Javanese Empire", with groups in both of these provinces taking advantage of the turmoil created by an OZ counter strike.
Increases in fuel costs in Indo are already creating friction there 1 2.
Playing this silly numbers game would suggest that the US should just roll over to the 1 billion Chinese! I mean thats still a 5:1 advantage! As if.
Australia's in a particularly unique position as one of the world's great coal exporters. It could potentially fall back on coal as oil becomes more challenging to import. Australia may be one of the few places on earth where Fischer-Tropsch synth fuel might work well on a national scale to supply the gap between consumption and production if imports effectively fall to zero.
One poster said Australia is a big produced of sugar cane. If it used all it's production for gasahol it could supply 20% of it liquid fuel needs.
Not sure if you have ever been to Aus, or indeed live there, but if there was anywhere setup for public transport, this is it. 5-6 main cities, 90+% of the population concentrated there - even an idiot could replace the car with public transport and create a workable system.
2-3 years and the consumption could be cut by at least 70%
Don't worry about Aus, worry about those countries dependent on imports, dispersed, and with little in the way of natural resources.
We tried electing a bunch of idiots but even they couldn't get public transport right. I think we shoudl give the morons and the imbeciles a go now.
I am reminded of the esoteric professors in university that pointed out the "intuitively obvious" to many an engineering student. This is no place for academic abstractions. That ship has sailed!
Reserve growth, technology advancement, economic pressures, lessening national control, yada, yada. And I say bullshit! There is only one metric that matters and that is oil is at record price and production is struggling to climb forward. Enough said.
The precepts of economics are about to get blown away. That is, economic theory has largely been based on commercial/social activity within an infinite resource world. It always amazed me how someone would dream to provide a pet rock to the American market and make their millions from trivial crap. What a business model...
Here and now we have 6.5+ billion (who last counted?) biped hominids occupying this fragile crust of a circling orb called Earth and we have come up against the limits. Heinberg said the "Party is Over" and its time to pick up the dishes. Please show yourself to the door.
If I were to put it in electrical terms, I would say the system is overburdened and susceptible to collapse - oh wait, that's been said. Well, I guess it is becoming intuitively obvious...
Decisive an issue as it is, ELM, I believe that at least as big an issue is hoarding (resource nationalism, etc. call it what you will) will become an even bigger one. When you know that what you've got in the ground is going up in value exponentially just sitting there, why lift it? Why even tell anyone it's there? Of course there will be storm troopers going around kicking down doors. That's the problem. In that sense Matt Simmons' call for openness is naive.
This factor is what makes the whole thing so explosive. Hoarding is the absolutely most rational thing to do for those that have oil. But this has the power to cause a decline far steeper than the decline of the resource itself, even an almost vertical drop at some point. I'll leave to imagination the reaction of the storm troopers.
I'm betting that the exporters won't hoard so much as let demand at home rip by keeping prices artificially low, and eat up the last of the seed-corn.
That is what all the ones who are tapped out already have done, anyway.
And I think that exporters are going to have considerable difficulty in restricting domestic consumption--when their cash flow from declining export volumes is (at least initially) increasing because of rising oil prices.
Oil producers make things worse by subsidising domestic consumption. The result is that Saudi Arabia has a per capita oil consumption higher than the US, which is ridiculous. If they charged World prices for domestic consumption they could export a lot longer. But there is no way of getting them to do this.
The value of oil is in the using of it, not in the selling. This is why the US can import oil, and turn it into valuable products that grow our economy. Turning other peoples energy into valuable products is how Japan came into existence. Why shouldn't the Middle Eastern countries follow that example?
The important thing for companies like Saudi Aramco is to make a profit - it's production costs are probably still so low it doesn't even need to subsidise domestic consumption, they certainly don't need to charge 'world prices' so why would they do it?
they need to fully supply their home market to keep their people calm
they need to mminimise exports to make the oil last as long as possible
they need to maximise income from oil but not build up reserves of foreign currency
their customers need to pay for what they import - debt won't do as the banking system only works long term if the world's economy is growing
The reality is that there's no way to know. Consumption is done publicly, hoarding by its very nature is done quietly. This is something that would would be done by any gov't that was acting rationally, either for the benefit its supporting elite or for the benefit of the people in the better case. It would not be an announced policy. I guess we'll have to wait for an otherwise inexplicably steep decline to see if there's any merit to this notion.
I'm thinking about it more. Oil is not gold - oil is better than gold. Gold is not being used up. Yet you do not see any gov't supplying their populations gold in unlimited supply. True, it's not a key element of everyday comfort and survival. A prudent and responsible gov't will not fully supply its population's thirst for oil recognizing its future value. But nor would an utterly corrupt one -- it will withhold oil just as it would gold, even more so, to the extent that it can. Why would it not?
BTW, Chavez has made remarks about the insanity of gasoline pricing in Venezuela. His is apparently unable to do anything about it so far. But is he pressing for the most rapid possible development of Venezuelan reserves?
You're absolutely right about hoarding of oil reserves, and that will probably happen to food as well. As the price of fuel skyrockets, the profit potential from ehtanol will rise along with it (as we have recently seen), and as that dynamic increases, food prices will go so high a certain percentage of the population will be unable to afford enough food to feed their families, and the consequence will be countries, regions, cities, towns, communities and families will hoard food. Then those that don't have food to hoard will seek out those that did using whatever means available.
Mr.Exporter only exports what he perceives as SURPLUS to his own needs. He can only export SURPLUS, as he perceives it.
PO-awareness warns of oil-starvation. When Mr.Exporter sees sees the approach of oil-starvation threatens, he will not sell his last ham sandwich.
Mr.Exporter will hold-back and HOARD before the last drop. Long before...if he is free to make his own decisions or his masters permit.
Such is not indicated in the ELM graph, because it is based on past performances, which did not include ANTICIPATION and HOARDING.
At some intermediate point, the graph of Export-decline will depart straight-line and begin accellerating toward minimums. Alarmingly. Shoutingly. And the myths of "free-market" and "fungibility" will be exposed as fairytales.
Because HOARDING terminatedly curtails the outflow of exports, allimporters simultaneously are forced to minimize consumption and promote conservation. It may result in a sort of forced cooperation among nations.
There can be a deliberate plan, quite sane and workable, that is done covertly to avoid panic. And I mean PANIC.
Consider the persons who control Saudi production and pre-suppose they have very intelligent worldview, high awareness and worldly street-smarts. What would you expect them to do? What would you do? How would your actions be different?
What would you expect them to do? What would you do?
I would expect OPEC to restrain production, drive price up and give the "importing" countries a chance to see the writing on the wall.
That is what is happening.
First oil becomes expensive. Later oil becomes scarce. Finally OPEC starts rationing. So much to the U.S., so much to China, etc... War is avoidable, but only if the "importers" realize the ration is less painful than the fight. If it's done right, we will go along.
Yup. That is a plausable scenario and seems to match what can be observed without contradictions. What seem to be contradictions resolve with a shift in viewpoint.
E.g. Restricting production and hence exports, openly or by any number of subterfuges, might appear illogical in terms of less profits, or lessened funds for the princes play with, or driving up world oil prices, or causing "instability" in the world markets, or causing sufferring in Africa.
On the other hand, these untidy aspects may be the price of forcing conservation and global cooperation to avoid Olduvai Gorge Syndrome.
The myths of "Free Market", oil as "fungible" and "The Invisible Hand" are being found out as pathetic flimflam.
The Saudi oil is controlled by an unelected dictat.
I would expect them to push the pedal to the floor to keep the mass of undereducated and non-self critical people something like "happy" (or not tipping point miserable).
At the point where the brick wall is coming up fast, I would press the ejector button (as would my family and fellow travellers), simultaneously shouting to the masses "so long, suckers!", and fly up into the air out of reach, deploy my parachute, and drop as gentle as falling goosedown into Switzerland and a great early retirement.
Great party, knew it couldn't last, time to go, watch the broken glass.
Lorenzo
I agree because I live in an exporting country and the few enlightened are tired of supporting the wastefulness of the southern neighbor via the NAFTA agreement. (what's that I hear? Storm Troopers at the door - no, just "Gut Feeling"). I am 100% in agreement that nationalism is the macro form of hoarding.
/vsyxx
("vsyxx" stands for IPV6 and as the ultimate optimist I have reserved address space for Io).
How do these bi-lateral assessments fit in with what has been characterized as a "global" oil market? Is it valid to assess particular exporting nations' future ability to export when Australia will be buying on a global market?
Go up to WestTexas' post to read about what will be happening in the world market. (in short: no oil by 2030).
Our middle case is that the top five (half of current world exports) in aggregate will be approaching zero by 2031, but some smaller exporters like Angola and Canada are showing increasing net exports--and the Kashagan Field is out there somewhere on the horizon.
However, some smaller exporters, like Mexico, are showing declines (with Mexico probably approaching zero by 2014), and smaller exporters tend to peak and decline faster than larger exporters.
WestTexas now that you have done a great job on crude exports do you feel ready to add in the finished product market on top ?
I think you will find that the shipment of finished gasoline from places that have have spare refining capacity will drop of rapidly as the crude oil export land advances. I expect this to be a issue by the end of 2008. Certainly by 2009. Crude oil export land model is not capturing the entire market and re-exporting finished products from nations with excess refining capacity plays a big role.
http://english.cri.cn/3130/2008/02/05/262@320757.htm
Actually, we are tracking total liquids, inclusive of product. I've used the Production Land and Refinery Land example. Assume that Production Land produces 2 mbpd. Refinery Land has no production, but 2 mbpd of refining capacity. Let's assume that each country consumes one mbpd of product, and let's ignore refining gains.
Production Land would export 2 mbpd of crude to Refinery Land, and Refinery Land would export one mbpd of product to Production Land.
So, Production Land's net exports would be one mbpd, and Refinery Land's net imports would be one mbpd.
But your missing refinery land to finished product import land which is not just exporters the US is the extreme example. Refinery Land -> Crude + Finished product import land aka the US will see a drop in finished product imports before it sees a drop in crude imports as Refinery Land ensures the local market is well supplied first. Or initially a significant premium for imported refined products. Thus nations without enough refinery capacity will quickly see the market for exported refined products dry up.
Lets take say France as a example of refinery land. They refine crude and export excess gasoline to the US. As crude supplies tighten they will initially have to ensure that the local market is well supplied regardless of the price of exported gasoline. France is not going to export gasoline and cause local shortages regardless of what demand is in the US.
Also at some point excess refining capacity will be taken offline since we simply don't have enough oil to keep these refineries running.
As demand for finished gasoline in the US is not met we see a strong upward pressure on prices to lure gasoline imports into the US. This means crack spreads widen for US refiners even as they pay more for imported gasoline.
This forces prices of oil up which causes refiners to slow purchases and cut back on gasoline exports rinse and repeat.
The point is the first market thats going to see a crunch is
Finished Product Exporter -> Finished Product Importer
Not Crude Importer -> Local Demand.
At least initially although the underlying cause is not enough crude the first market to get hit is finished product exports from crude importers.
In particular gasoline and diesel imports.
This is a lot of the third world thats going to get hammered as the US tries to meet gasoline demand and in the US I expect us to see surprising increases in gasoline prices and refiners have to cover the additional cost of gasoline imports.
Eventually crude oil export land kicks in and the US for example is caught in a double import land problem. Its not getting enough crude for its refineries and gasoline imports are practically zero. But notice that gasoline imports should drop well before crude imports become a problem to Finished Product + Crude Import Land.
Next your dynamic of crude export plus finished product import land aka Mexico is alive and well in the case of the US they probably have little choice but to continue supporting Mexican demand for finished product even as US demand is unmet.
Given your time frames for crude export land /import land becoming a problem finished product import land should have problems effectively now.
WT: Re Canada, Ontario is getting the oil from overseas. How do you expect this situation to resolve itself as the top 5 approach zero exports?
I'm not WT :)
But in my opinion this is the sort of situation that potentially explosive for prices. Prices are set at the margin. As Ontario starts having problems with imports probably internal imports either with the US or the rest of Canada become viable. All this does is shift a hot potato of unmet oil demand elsewhere. What your seeing is that the import export markets for oil and finished products start destabilizing. A extreme example is Venezuela which is trying to get out of a natural market with the US for political reasons.
This churn and former import/export routes become volatile is going to really drive spot prices and more and more refiners/ finished product importers are forced to purchase at spot prices to meet potential shortages.
Market volatility sets in as formerly stable relationships are broken and longer term contracts are increasingly redone to track spot prices.
A example is with shipping now most companies have turned to passing through bunker fuel surcharges directly to their customers.
At first its a big game of whack a mole but after a bit people will realize that some of the holes no longer have moles.
In the event of shortages or even severe price shocks, I can see very strong political pressure to ship western oil east instead of south. Whether or not that is allowed to happen (via at worst US military intervention) remains as an exercise to the reader. I don't think the pipelines even exist now, although I suppose quite a lot could go by rail. NAFTA basically prohibits us from doing this, so it will definitely get ugly fast.
I remember something about shortages in Ontario I believe from a pipeline or refinery problem and what happened was finished products where shipped up from the states. NAFTA works both ways. The US to keep NAFTA going has little choice but to ensure that Canada and Mexico continue to get all the finished products they need. So I think the net result is simply that the US will be forced to use every trick it has to get more oil and finished products effectively on the open market. But this is just going to cause a ripple effect.
This causes increasing uncertainty in supplies well before actual supplies become a issue. This uncertainty is whats driving prices higher right now not fundamentals as OPEC loves to point out. But its just a harbinger of more problems coming soon. Each time a refinery has problems securing oil supplies from formally secure sources your going to see them going to the spot market and resorting to increasing stored oil and finished products ( hoarding ).
No one wants to be the first to have persistent shortages.
Good points-should be interesting.
Good point. If the analysis was constrained to the legalese of the NAFTA agreemet. However what happens is as soon as the terms are no longer beneficial to the U.S. they balk. The specific terms of NAFTA gets kicked to the curb and they choose to fight it out in court while prurient industries profit.
After all, they have many, many more lawyers than us!
/vsyxx
I think these bi-lateral agreements are coming under pressure. I am living it day in and day out as energy "producers" (I hate the term) are looking for ways around the existing structure. That is, potential energy is finding its way through the path of least resistance.
I guess that is all it comes down to, simple thermodynamics. "Entropy wins every time" (yes, that's my saying. I coined it. Use it, but please acknowledge). Stand back far enough and the dynamics closely resemble physical systems. Cold, lacking of higher learning, you bet!
Not of the reductionist camp, but when viewed from the lens of the great omnipresent being, one cannot discern between the semi-hairless bipeds and the Chimps.
/vsyxx
I would guess that the spot market will bwe eliminated in favor of bilateral agreements between Russia/Germany, Saudi/USA, etc. in a few years at fixed long-term prices then we can forget all these ELM models and any knowledge of production ansd supplywill be state secrets.
If I remember right Australia has one of the highest per capita consumptions and like the US a liking for large cars so plenty of potential for cutting consumption there:-) From what i remember most of the taxis run on LPG.
Luckily for Australians it is a large sunny country with lots of resources and comparatively few people so PV could help out.
Yep, we love our big cars, down here, but not for much longer. The market for the locally-produced Holden (GM) Commodore and the Ford Falcon is shrinking so fast I'm surprised there's not a permanent clean-up crew standing around below their respective CEOs office windows. Small cars are now all the rage, although, in a BAU world, the sun will never set on the 'big aussie V8', as the distances between population centres is quite an amount. Our love affair with the car has also put paid, time and again, to any notion of serious funding for Mass Transit, with the result being that recent high Petrol prices is seeing the existing MT network bursting at the seams, all over the country.
If we had sensible people in positions of authority, we'd be building a 100kmh rail network conecting every population centre over 50k people, but instead, we've got the Rudd 'the script said 60% cuts in emissions, Mr Garnaut, not 90%' Labor Government who are verbalising tax incentive to drill for more Oil locally.
Australia has more sunlight than we have any right to expect, yet suggest a Solar Thermal be built, and the naysayers come out of the roodwork faster than termites running from Dragnet FT. "These plants are huge", they say, ignoring that a FF plant can occupy 20 square kilometres of ground. We've other options as well, but, like the US, we'll wait until it's obviously too late before trying anything. Wouldn't want to spook the markets.
Re: Oil producing countries service internal markets first and then export their surplus.
I propose a corollary to westexas's ELM: Grain producing countries service internal markets first and then export their surplus.
Since Peak Oil implies that grain is a function of oil production under the current system and if push comes to shove, we have to play our strong hand to offset the oil exporters. Our strong suit is grain exports. Let the grand game begin. Let's see who can survive without oil and who without grain. I suspect oil exporters who want to import grain may be willing to share the pain for some grain. We live in interesting times.
And where does that leave the US which is turning all its surplus grain to ethanol ?
I agree with you however securing oil supplies is going to increasingly include a lot of other dynamics besides price in the future.
However if you guys keep having droughts its not clear that the grain surplus will continue. Global Warming is also a issue when you look at ties between oil and food.
I think your can feel the tension :)
Getcha popcorn ready.
No worries, the Saudi Oil Minister is "determined" to keep oil prices down to $25. . .
http://www.time.com/time/world/article/0,8599,1715308,00.html
IMO, the great bulk of the posts here are working out the details of an upward spiral of export prices and downward export supply. But where is the end point of this? It really can't go on forever.
I think it must end in a transition to a solar/biofuels economy. (and for me, biofuels is a form of solar). Australia seems to me to be better positioned than US to make this transition: Australia's population density is 2.6/km2, or 38 ha per person. US pop. den. is 31/km2, or only 3 ha per person. Plus Australia is at a generally lower latitude, where insolation is better. (numbers for all countries are available at http://en.wikipedhttp://en.wikipedia.org/wiki /List_of_countries_by_population_density )
The Falkland Islands and Greenland have vastly better (lower) population density than Australia, but are too polar for plausible solar.
geek7,
Most of Australia is inhospitable desert that is useless for just about everything except mining. A better comparison would be to calcualate Ha per person of arable land and this may give you a better sense of value.
Ha/person arable land
Australia 2.506
Japan 0.036
United Kingdom 0.095
Canada 1.270
USA 0.598
China 0.111
European Union 0.217
(a Hectare is 10,000 m2 or a little over 2.5 acres)
source http://www.ga.gov.au/education/facts/dimensions/compare.htm
From this you can see that Australia is blessed with plenty of land but it is not quite a 10 x factor over the USA. There is also a question of quality of soil, water and rainfall which would need to be taken into account to give this comparison any real meaning. Oz is very dry at the best of times but this latest drought has been going on for a decade which reduces production considerably. It also takes a considerable amount of oil to farm large areas, particularly crops where moisture is thin so palnting densities need to be wide.
Still, Australia is reported to feed about 70 milllion people and a lot of those are in the middle east. Maybe our grain and sheep meat might be more attractive to them than US dollars or Chinese trinkets?
" inhospitable desert "
Yes, I know much of Australia is inhospitable desert. That is why it is still available for installation of solar collectors and other large-area facilities. One kind of large area facility might be for capture of CO2 from the atmosphere as has been proposed by several people, most recently to guys a Los Alamose Nat. Lab. who want to tie this good idea to nuclear power. Instead, I think CO2 might better be fed to algae ponds (another large area facility) for production of biodiesel. Algae ponds in the desert don't compete for arable crop land which is not plentiful anywhere in a world of >= 6 billion souls.
This is not something that will happen in this decade, but it is a sustainable end-point.
Large scale solar PV in the desert sounds good until you start to understand the scale of a project that would produce enough electricity to justify the investment. Besides the issue of efficiency, there are transmission lines to transport the energy that would need to be built over huge distances.
Algal bio-diesel requires lots of water that we just don't have in Australia so thats probably out too
Most people would consider CSP (solar thermal) power, not PV, for large scale desert installation.
For a large enough power source, transmission lines can be built (if you built, say 3 gigawatts of CSP in the south aust desert, I'm sure the cost of linking this into the NEM would not be prohibitive).
As for water, the north of the country has plenty - grow algae for biodiesel up there (if the process can be made practical).
In addition, the water doesn't have to be drinking water, it just has to be wet. A mix of brackish salinated water and sewage would work fine. There is a suitable algae for almost every condition.
Are there any biofuels companies in Australia that we should know of?
No major ones (our largest one operates mostly in the US IIRC, producing that wonderful corn based ethanol stuff).
Biofuels don't get favourable tax treatment here - most companies that have tried to produce biodiesel on a large scale have been wiped out by feedstock price rises in the last year.
You can get E10 at the pump, mostly produced from grain and waste products, but the volumes aren't large.
No one (to my knowledge) is producing ethanol from sugar cane. I haven't managed to work out why this is so.
Brazilian ethanol is kept out of the local market by some hefty tariffs as well (I think).
CSR (ASX:CSR) is a major producer of ethanol from sugar cane. Their product is sold in E10 fuel at United service stations in most major cities in Australia. BP, Shell and Caltex also sell E10 but I don't know whether CSR is a source for them.
E10 fuel is normally 3c cheaper than unleaded petrol as the 38% fuel excise is not applied to the ethanol component. This federal government subsidy will expire in a few years.
Speaking of ethanol, I attended the Clipsal 500 touring car race in Adelaide today and a major announcement was made regarding biofuels for the racing cars. From 2009, all cars will run on E85.
Yes, if only Australia had a vast, largely uninhabited, desert in which we could build Solar Power Plants... ;)
Many Australians seem to think there's nothing west of the Great Dividing Range.
This is a really good post because it very concretely shows the kind of predicament any country, not just Australia, can suddenly find itself in. My question is about the predicament of oil exporting countries once they find they are using all their oil and have no earnings to buy cars, bottled water, jewels and Armani suits. Some governments will presumably try to make sure domestic consumption is restricted so the necessary exports are available. However it happens, I guess we will continue to see some oil seeping into the market but it will be very much in the interests of exporters to ensure that prices are as high as possible.
Well I for one do not want to live in a former oil exporting country. I think Indonesia and Mexico will get very dicey in the coming years. Decades of inequality are going to fuel some pretty major uprisings.
For that matter the US is a former oil exporting country :)
I would not hesitate about living in a former oil exporting Norway regardless if their oil fund keeps its value. On the other hand I am a Swede and would not mind a "structural reform" of the nordic countries, it could save billions and make us economically stronger.
I think you are right about oil exporting countries being in trouble. Australia is an oil exporting country but we then import a lot of finished product and crude of various grades to match out refineries. We have also always been exposed to world parity pricing which has annoyed many of the unwashed who think Australian oil should be given out at cost to Australians first!!
Many of the exporting countries do in fact sell petrol (gasoline)to their own citizens at a subsidised price which has encouraged high use and dependence way out of proportion to actual need. As the exporters find dwindling surpluses, they will be forced to withdraw the subsidies for their own and this will cause social unrest. (Witness Iran last year). They will have no choice however as many of these countries are large importers of food and that food will increasingly be paid for directly with oil as US dollars will be laughed at as a medium of exchange.
If it comes down to a fight between food or gasoline, food will win and once again the west will triumph
One thing the demand destruction proponents of reduced oil prices ahead don't consider is the ELM. They seem to figure a bad economy demanding less oil supply growth = falling oil prices. But in reality, you have to destroy all the exporter domestic demand growth just to set their export decline rate = their production decline rate. Then on top of that, you must destroy demand faster than the production rate decline to put any downward pressure on oil prices. And, as was pointed out upthread, much of oil demand is by rich governments and entities that don't have a lot of discretionary choice about buying oil. All this funnels a huge amount of demand distruction duties down upon those who would refuse enough oil to carve the price down for very long.
In the really bad economy of the '70s, demand not only wasn't destroyed, it surged at over a 3% annualized rate for the 10 years that saw oil prices climb nearly 1000%. This resulted in two sets of U.S. Congressional hearings in '74 and '79 (two severe recession years) about Aramco, then run by the Americans, overproducing and damaging the Saudi fields in an attempt to keep pace with all this demand! This put the production surge of the '70s into the global profile (people saying the high oil of the '70s was artificially caused by restrained supply/embargo is just plain stupid). Keep in mind this was with no peak oil or ELM issues at work. Post peak, with the BRIC nations fast emerging, demand destruction bringing back cheap prices is a very difficult proposition.
Well eventually demand destruction will happen and has happened to a certain extent since real demand cannot exceed supply. I think however what the oil nations see is that oil importers are very wasteful and can afford to pay much higher prices for oil. I don't see serious demand destruction until oil hits over 500 dollars a barrel or above 10-15 dollars a gallon for gasoline. Before this conservation efforts can easily handle the increased costs.
For example you can easily go from 20mpg to 40 mpg by changing cars. Another lifestyle choice is to move to a cheaper place half the distance from your work.
So if your driving 40 miles one way then move closer say 10-20 miles. And if your paying 4k a month on a mortgage you can easily let the house go or sell it and rent a apt or house for say 1000-1500. That would get you a extra 2000k at least a month to spend on higher food costs and higher gasoline costs. And this is without changing your car. If your smart you buy a fuel efficient car and let the SUV and McMansion go back to the bank if you cant sell. So you can see that a lot of people by giving up the SUV/McMansion dream can make it just well even if prices go as high as ten bucks a gallon.
Its somewhere over this that lifestyle changes no longer work.
But at 10-15 bucks a gallon practically any reduced organic fuel is viable its a matter of availability. And we have not even included at least a belated attempt to increase public transport car pooling etc. What you can't do is deal with shortages. At some point getting oil becomes a issue not its price. And I think free markets will cease well before we hit 500 bucks a gallon.
The wheels are coming off suburbia now and as gasoline climbs past 5 bucks a gallon it will only get worse. But the end of suburbia is not the end of the world.
the end of suburbia isn't even the end of suburbia.
"But the end of suburbia is not the end of the world."
Now that my friend is a question of perspective.
To working and middle class Australia it might as well be the end of the world. Not in terms of the collaspe of civilisation - but rather as the collapse of the Australian dream (substitute American dream here). It is the collaspe of the great lie - that everyone, with hard work - can have the house, car, family, job, the place in the sun - the good life.
I talk to people my own age (26) and most find it inconceivable to live any other way - it is an unexamined cultural absolute, a rite of passage into "adulthood", into respectability - the pride in the eyes of eyes of their house and status obsessed baby boomer parents. Chaining yourself to an insane mortgage that breaks every rule of rational investing is openly encouraged. Chaining yourself to a job you hate to pay this insane mortgage is being grown up.
Eventually society will muddle through and sweep away the wreckage. Western nations will probably cope better then the pessimists give credit. But something will be lost - the remanents of that bruised and tattered idea of the Australian dream. That beautiful dream of the 50's that is still tied to the prow of the current capitalist system, held up to all to prove the rightness of the current system. When it dies - it will almost be an absurd loss of innocence. That final yardstick of the good life, that fundamental satisfaction that will no longer be achieveable - but it will be far from forgotten. Societal progress finally recognised by the majority as doing a abrupt U-turn.
Seriously, that is one earth shattering cultural change for the working and middle class. What will replace it? How satisfied will they be with is a reverse in fortunes from the last generation? What will they do politically?
To the people that plod along on the accepted track and rarely lift their heads - this will be the societal equivalent of catching sight of the Mac truck of History after it has run them down. The final death of the dream. Hell, to the people out there in TV land, it may as well be the end. I feel sorry for them already.
Cry me a river. Seriously if you consider that we have used up millions of years of fossil fuels and probably destroyed our climate for a thousand years. And caused the extinction of thousands if not millions of species just so a few hundred million people could have a SUV/McMansion.
I'm not sorry for anyone including myself I've spent most of my life blowing energy chasing the stupid American dream I can't give that back. If people don't realize what we have done then tough. If they do then they will happily change their lifestyles.
The truth certainly hurts - but what I am getting at is that the shortages and upheaval will be temporary (say 20-30 years as per a Hirsh style changeover) while the change in the cultural sphere will be the real and enduring result from this whole episode. Not the shortages, but what they mean in the context of majority's worldview. The current middle class enjoy a certain standard of living. To drop that suddenly is to introduce massive discontent. A cultural identity crises of sorts.
Something like this completely undermines the current economic paradigm. It utterly shakes the confidence in the current system, reminisent of the 1930's in the US when capitalism's
little brother socialism was the flavour of the month. In my mind - a lack of confidence by the majority in the system itself gives a mandate to the Government to act against unfettered capitalism in a way that is political suicide nowdays. Perhaps enough to enact all the sensible but politically impossible economic and environmental control measures that have been ignored since the 70's.
That's the good - the bad is that a large majority of basically good people, whose only crime is that they followed the dominant and universally accepted worldview of their society, is about to take a big hit. Possibly wiping out their house values and superannuation as their funds go down the toilet. They deserve a kick up the arse for not being more informed as a citizen - but they don't deserve to have a lifetime of hard work pissed away.
Environmental problems, resource depletion, overpopulation and over-consumption - If our leaders, academics and technocrats didn't see the mess that was being made - how can you hold it against the working joe?
Amen!
But everybody in a well run country can have a job, a home, a family, plenty of electricity, transportation and the sun shines on everybody.
We dont need all this oil to live good lives.
Thank you for (correctly) pointing this out.
The oil fetish leaves me shaking my head sometimes - there are plenty of alternative sources for energy - and they are a lot cleaner than the oil / coal based energy system we currently have in place...
GAv,
I know its late but really?? Cleaner yes, but scalable? Surely you of all people know that running our curent way of life on solar panels and wind turbines is a crock.
I have just come home from a 40th birthday held in a country housing estate of 1 acre blocks that contain 40 square homes with triple garages. As lovely as it all is, no amount of solar or wind is going to keep that sort of thing going. The people there were all 30-40 somethings, chasing the Australian dream and fully expecting to get it. They are not the sort of people who will be prepared to wait either and I couldn't help wondering what they would all think of the implications of aeldrics post if they had the sense to seek out such information?
This situation is very much like an unforeseen meteorite strike that wipes out most of the primary energy production in an ecosystem. Many people that thought they were immune by virtue of their technology will see that their homes, businesses and infrastructure will become old dinosaur bones in a fairly short period of time. The large stocks of energy that this infrastructure was meant to process will be gone. There will be a scramble to adapt and survive but the old system will continue to munch and crunch through the fossil fuels even though most energy will be needed for a successful adaptive overhaul.
When the message gets through it will likely be too late to adapt, energy will be too expensive, too precious and hoarded by its respective owners. Many that have not gone insane will occupy deteriorating infrastructure without services and their primary occupation will be finding food and preventing others from stealing it.
Imagine this edict, “in twenty years ownership of personal automobiles will be outlawed”. Hard to believe, but this is probably where we will practically be in that time frame. We must adapt with some foresight of which I see very little. Events as are occurring now are termed “punctuated equilibria”, a process whereby many species (technological and/or organic) go extinct suddenly and are then replaced by something else or someone else, probably weeds and mice and other hardy beings that survive on sunshine.
I saw a headline where an Indian "moghul" will soon build a billion dollar home while Dubai creates a fantasy land in the desert. The arrogance and stupidity is just overwhelming. I think the system accelerates towards its ultimate destination.
Eventually yes - this is true. However going through an economic depression for 10-20 years will make life very difficult no matter how well run your country is. Try pulling that one out when there is double digit unemployment and see how well it flies ;)
In the UK petrol (gas) and diesel are around GBP 1.10 per litre or roughly USD 2.20 with similar prices in the Netherlands, Belgium is a little cheaper but not much. I think this is already approaching USD 10 per gallon and people are still keen to buy large cars so i don't see much reduction until it is at least 50% as much, i.e. USD 15 per gallon.
India's Increasing Oil Imports
This chart is indicative of Indian Oil Exports in negative territory, a representation of rising imports.
Source: Energy Information Administration, USA
Across the Indian Ocean from Australia India was slowly increasing its oil production, yet its desire for oil imports outpaced its ability to increase supply. In some nations demand for oil was falling, this was not the case in India.
As Memmel points out, a point will come when there will be more refinery capacity than crude oil to fill it.
Nations that have crude but insufficient domestic refinery capacity need to export crude and import refined product.
Such nations almost inevitably subsidise the cost of refined product domestically in order to prevent riots.
Eventually there will be more nations 'with money' bidding for crude supply than there is crude.
Oil prices rise. Product prices rise. The exporting country without refinery capacity has to buy increasingly expensive finished product. The cost of the domestic subsidy gets out of hand.
But wait a minute! The crude exporting country controls the oil. This dictates the price...
Lets cut a deal! Exporting country Guarantees supply to refining country in return for 'below world market prices' for finished product.
So a bizarre 'fifth dimension' pricing scheme of bilateral crude and finished product could come about.
Imagine the cost of idle refinery plant.
Imagine the subsidy a government might pay a refiner to make the deal sweeter.
Refinery bidding wars for certain crude producing countries at cross-over point 'x'?
Lorenzo
"However, if it is 30% we face an economic catastrophe."
So, if the current consumption is 920 Kbpd this means that consumption should decrease to 644 Kbpd to meet availability. But the economy was using only 600 Kbpd in 1980. I'm sure the Australian economy was alive and well back then, so how can this be a catastrophe?
The population in 1980 was ... half what it is now? ... and the climate then was ... the same or was it different? In 1980 the world was much less complex and interconnected - complex things often fail spectacularly and unpredictably.
In 1980 the world had a growth paradigm, but what you are talking about is a contraction paradigm - each year less and less consumption (it won't stop at 30%) less and less jobs, failure of things like the banking system that REQUIRE growth to function correctly, disputes over resources (that may be very serious).
But above all, less and less food as our world food production/distribution system depends on large quantities of Fossil Fuels.
The population of Australia was a bit over 14 million in 1980. It is just over 21 million now (http://en.wikipedia.org/wiki/Australia ). To put it another way, the population of Australia is 50% larger than it was when we used 644 kbpd.
People can adapt to anything. We will adapt. But we can't adapt to that kind of change in such a short period of time without some really serious consequences.
Australia has coal, iron ore, alumina, and uranium reserves the rest of the world wants desperately. Not to mention a huge quantity of exportable agricultural produce in an average year (Australia had incredibly good rain the last 6 months ...). As oil price rises Australia is in the catbird seat because the rest of the world must still trade for such fundamentals.
Furthermore judging from Ilargi's site the US is evidently headed toward a deep black depression within the next year. Its dollar diving, its banks turning into junk bond merchants, and its industrial base withering on the vine - 3 million US manufacturing jobs lost in just the last 8 years. And no one really wants to buy any more war machines at the monent, thanks ...
Consequent demand destruction in the world's biggest importer and its trading partners means all bets are off for the ELM. Looks like Australia is still the place to be to me.
To a certain extent. But understand that the brisk price increases in commodities outside oil are eventually driven by the American consumer and his 200k of heloc money. Over the last few years a lot of people where pulling in six figure incomes by taking equity out of their homes. The fueled china's rapid growth. As contraction sets in the boom market in a lot of commodities will fail. But oil will probably remain expensive since oil usage is relatively inelastic. Thus your mining companies will be faced with falling profits and rising costs.
Look at the US and Canada our timber markets are already in a deep depression. Our boreal forests are being killed off by beetles and we can't even use the timber.
I think in many ways Canada and Australia share a lot of the same economics so as goes Canada so goes Australia.
I actually expect the Australian mining to collapse and profit margins to get razor thin over the coming years. The only bright spot is uranium. Coal production stands a good chance of getting nationalized and turned into CTL.
In any case extraction and delivery costs for coal should increase significantly and the demand in Asian markets will weaken.
I think the market for metals is inextricably linked to cheap carbon. Take away low cost thermal coal and coke and there is less demand for ores of iron, aluminium, nickel, zinc and so on. If cheap carbon goes so does the rest of the mining boom, aside from uranium. The laid off auto workers who have been offered jobs in mining towns may end up back in the city. Nobody is telling them they might get only five years work in the mines then it's back to zero.
I thought that in many regions of the world they were having difficulty starting new mines?
And also that finance was tight and demand from China ans India likely to hold up?
Not that I know anything about it, just asking!
Not in Australia which has a pro-mining culture. I was in a town recently (Zeehan, Tasmania) where a local pointed to the ring of hills and said when that deposit runs out we'll start digging over there and when that runs out we'll dig over there. The thinking is get-it-while-you-can. However the preconditions are cheap energy and demand from China and India. As they say all good things must come to an end.
The Chinese aren't about to stop expanding and the Japanese have no other easy supply of these fundamentals. I don't think Canada does much on asian markets, so the parallel ends there.
As for CTL, that'll be great for Australian mining if it becomes economical. Doesn't much matter if it's nationalized or not if it keeps Australia afloat.
Time will tell.
Not sure about Nationalisation. From memory, we tried to nationalise the banks a few decades ago, and it was ruled Unconstitutional.
Debt...........
Everyone conveniently ignores personal and business debt.
Australia for all intents and purposes has debt second to none in the western world.
Australia has debt AND increasing interest rates.
Interest rates have been increasing to curb inflation but all it is doing is increasing the debt bubble. Wages are not increasing in pace with inflation so the increasing and continuing consumer spending is financed by credit.
What will happen when business and consumers finally maximize their credit sources.
Or does everyone expect debt to grow exponentially forever.
Australia does have a lot of debt but unlike the US, we have had a superannuation scheme whcih forces people to save a certain amount of their wages and for at least the last 8 years a government that paid off the national debt and socked a fair bit away in a sovereign wealth fund (Future Fund).
While the suburban economy might get smacked (deservedly) by high interest rates and tightening credit, the productive economy such as mining and agriculture will find new sources of capital such as super funds, to keep them ticking along. Consumers however are &$#@ed
Question - considering that Australia exports resources and commodities to countries like China, and is part of the US military stragety, would it not be in the best interest of those countries to ensure that Australia still gets a sufficient piece of the global oil pie?
Interesting to contemplate how those countries can ensure that Australia still gets a sufficient piece of the global oil pie. By the time the situation is so bad that Australia cannot buy enough oil do you think that China will still be needing all those resources to turn into "indispensable stuff" to export? I doubt the US will want to forego any of "it's" share:-) All shared out equitably or last man standing?
At least Australia has one of the lowest arable densities and is warm so disregarding water must be one of the best places.